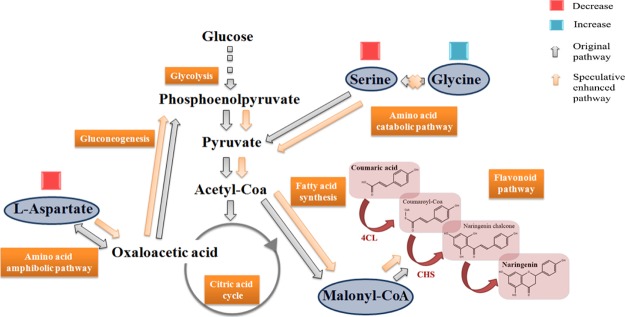
Figure 4.
Metabolic changes induced by naringenin production in S. cerevisiae. The speculative enhanced pathway by naringenin producing strains (shown by orange arrows) mapped onto metabolic pathways (shown by gray arrows). Blue and red boxes demonstrate the decrease and increase of the targeted amino acid amount.

