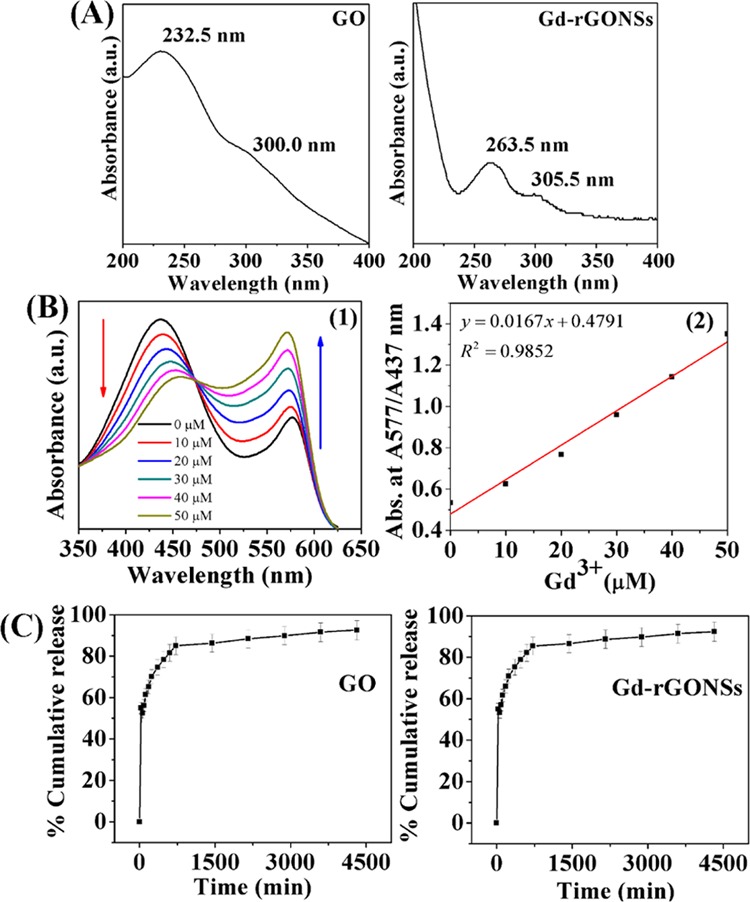
Figure 4.

UV–visible absorption spectra of graphene oxide (GO) and Gd-reduced graphene oxide nanosheets (Gd-rGONSs) (A), spectrophotometric detection of Gd3+ ions by complex formation with xylenol orange; calibration curve obtained by increase in Gd3+ concentration from 0 to 50 μM in acetic buffer (pH 5.8) causing decrease in band intensity at 437 nm (indicated by the red arrow heading downward) and increase in band intensity at 577 nm (indicated by the blue arrow heading upward) (B1), and the calibration plot obtained for absorbance ratio A577/A437 versus Gd3+ concentration from 0 to 50 μM (B2), cumulative 5-FU release (%) profile of GO and Gd-rGONSs in phosphate-buffered saline (PBS) (pH 7.4) at 37 °C (C). The line graph data shown in release profile represent mean ± standard deviation of three replicates.
