Figure 6.

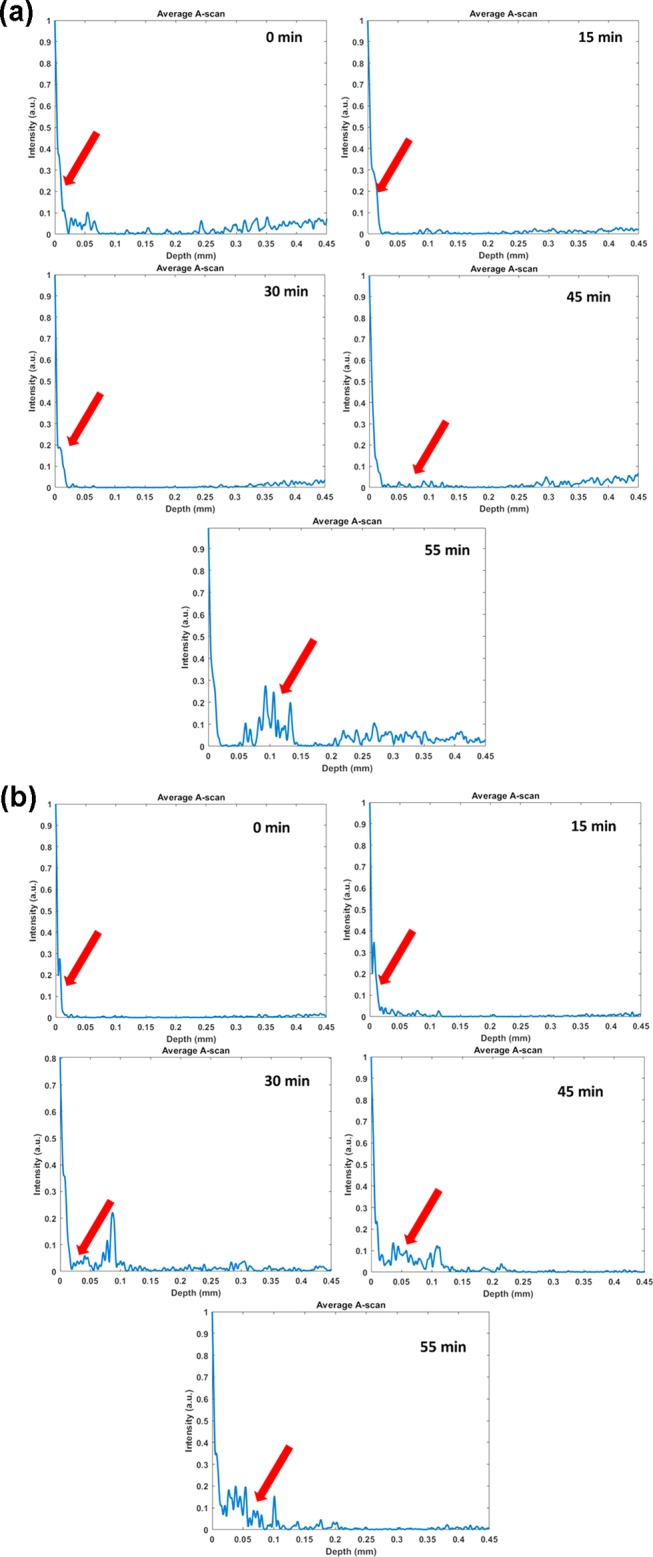
(a) Single average A-scan profiles indicating signal obtained from deeper layer of the tissue (epimysium) for GO. (b) Single average A-scan profiles indicating signal obtained from deeper layer of the tissue (epimysium) for Gd-rGONSs.

(a) Single average A-scan profiles indicating signal obtained from deeper layer of the tissue (epimysium) for GO. (b) Single average A-scan profiles indicating signal obtained from deeper layer of the tissue (epimysium) for Gd-rGONSs.