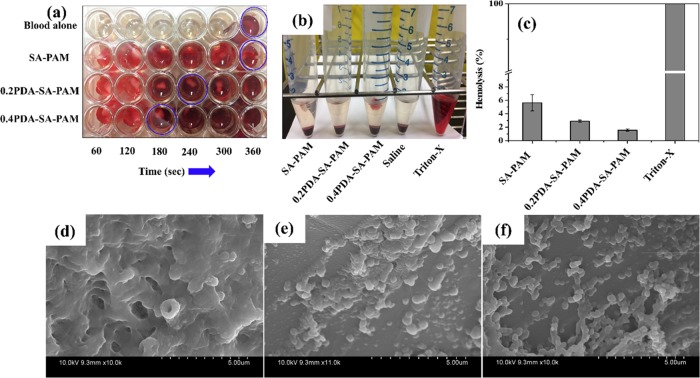
Figure 8.
Hydrogels treated with pig whole blood, (a) photographic images of a blood clot formed with respect to time, (b) photographic images showing hemolysis, (c) hemolysis (%) of different hydrogels (*p < 0.05). SEM images of platelet adhesion on (d) SA–PAM, (e) 0.2PDA–SA–PAM, and (f) 0.4PDA–SA–PAM hydrogels.

