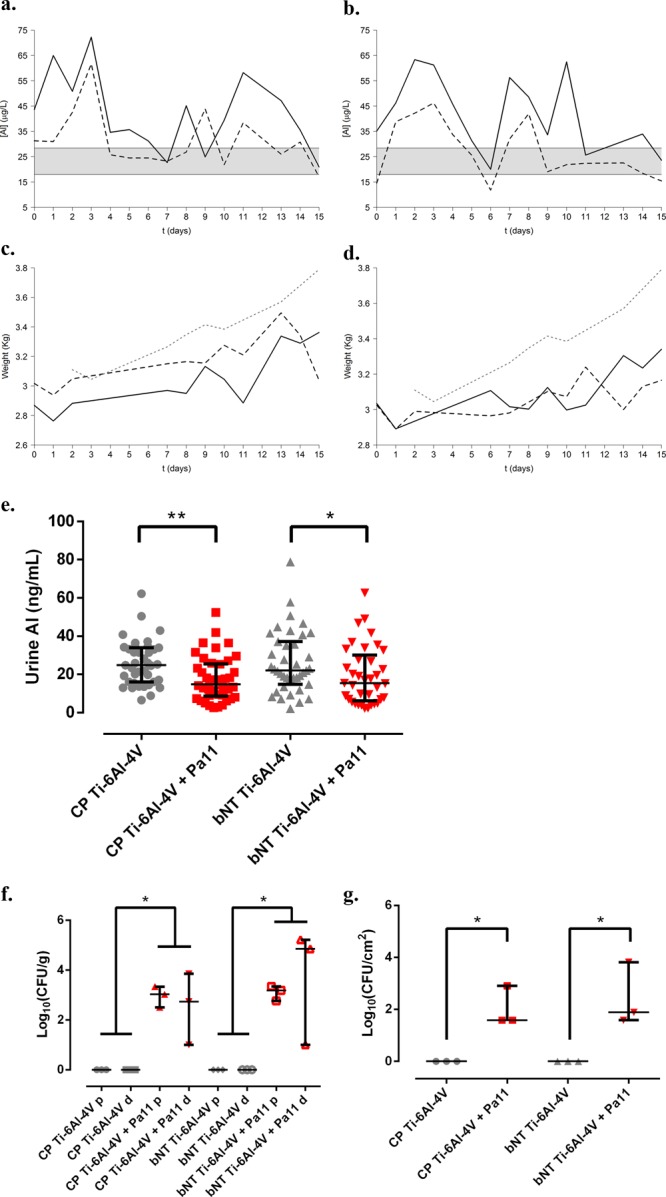
Figure 3.

In vivo model for total Al monitoring using the urine of rabbits with a single implant with and without P. aeruginosa infection (Pa11). Mean urine Al levels and weight in rabbits with a single implant of CP Ti-6Al-4V (a,c) and bNT Ti-6Al-4V (b,d) over the first 15 days postoperatively. The black line represents the average values for animals without infection. The dotted black line represents the average values corresponding to the animals with Pa11 infection. The gray area represents the 95% confidence interval for the levels of Al in the urine of the control animals. The dotted gray line represents the average weight of the animals in the control group. Mean levels of Al in the urine of animals with an implant of each material (e). The bars represent the interquartile range. *: p < 0.05 for Wilcoxon test between the groups of each material with and without infection. **: p < 0.01 for the Wilcoxon test between groups placed with implants of each material with and without infection. Median bacterial concentration (CFU) per gram of bone and adnexa (f) in the proximal (p) and distal femoral diaphysis (d). Median bacterial concentration per square centimeter in the prostheses (g) of each experimental group. The bars represent the interquartile range. *: p < 0.05 for the Wilcoxon test between the compared groups. **: p < 0.01 for the Wilcoxon test between the compared groups.
