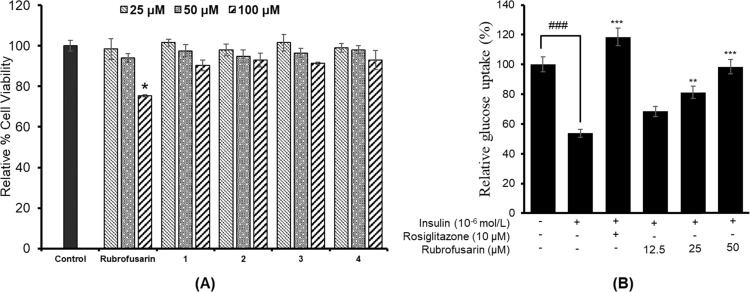
Figure 3.
Effect of rubrofusarin and its glycosides, rubrofusarin 6-O-β-d-glucopyranoside (1), rubrofusarin 6-O-β-d-gentiobioside (2), rubrofusarin triglucoside (3), and cassiaside B2 (4), on cell viability in HepG2 cells, and *p < 0.05 indicates significant differences from the control group (A). Effect of rubrofusarin on insulin-stimulated glucose uptake in insulin-resistant HepG2 cells, and ###p < 0.001 indicates significant differences from the control group; **p < 0.01 and ***p < 0.001 indicate significant differences from the 10–6 M insulin-treated control group (B). Data shown represent means ± standard deviation of triplicate experiments.

