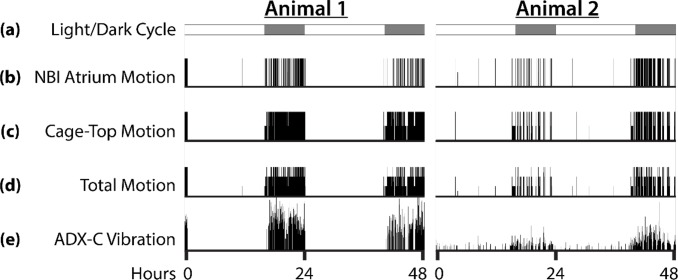
Fig 2. Actograms showing activity from two separate animals over periods of 48 hours.
The x-axis represents time, and motion is reported in arbitrary units on the y-axis. (a) Schematic showing light/dark cycle. White bars indicate light, and gray bars indicate dark. The animals were held under “summer” conditions of 16 hours light and 8 hours dark. (b) Activity data recorded from NBI atrium PIR motion sensor. (c) Activity data recorded from two cage-top PIR motion sensors. Output from each sensor was weighted equally and summed. (d) Activity data combined from NBI motion sensor and two cage-top motion sensors. Activity from each of the three PIR sensors was weighted equally and summed. (e) Reference activity recorded from a Sable Systems International ADX-C pad placed under the cage. This method of activity recording detects all vibration in the cage caused by animal movement. The data underlying this figure can be found in S1 Data. NBI, nesting box imager; PIR, passive infrared.

