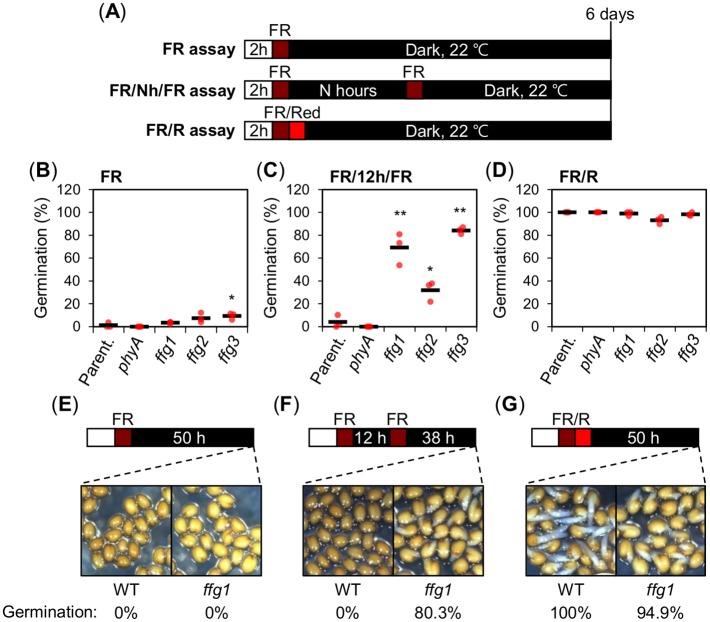
Fig 1. Identification of ffg mutants.
(A) Diagram depicts the different light treatment assays applied to seeds and used throughout this study. In all assays seeds were kept in darkness at 22°C following light treatments and germination percentages were determined as radicle protrusion after 6 days. “FR assay”: a FR pulse (3.69 μmol m-2 s-1) is applied for 5 minutes (min) on seeds previously imbibed under constant white light for 2 hours (h); “FR/Nh/FR assay”: same as a FR assay but an additional FR pulse (3.69 μmol m-2 s-1) is applied for 5 min on seeds N h after the first one. “FR/R assay”: same as the FR assay where the FR pulse is immediately followed by a R pulse (14.92 μmol m-2 s-1) applied for 5 min. (B-D) Scatter dot plots show germination percentages of parental line (Parent.: WT(Col-0)/pGA3ox1::LUC), phyA-211 (phyA) and ffg1—ffg3 mutant seeds in a FR (B), FR/12h/FR (C) and FR/R assay (D). One biological seed batch sample was used to measure the average seed germination percentage using three technical repetitions. For each repetition, the germination percentage of 50–65 seeds is shown by a red dot. The average germination percentage for the three repetitions is represented by a horizontal black bar. One-way ANOVA followed by a Tukey HSD test shows statistically different values compared to Parent. (* p<0.05 and ** p<0.01). (E-G) Representative pictures of WT and ffg1 seeds exposed to a FR (E), FR/12h/FR (F) and FR/R assay (G). Pictures were taken at the time shown in the diagram. Germination percentages are shown under each picture.

