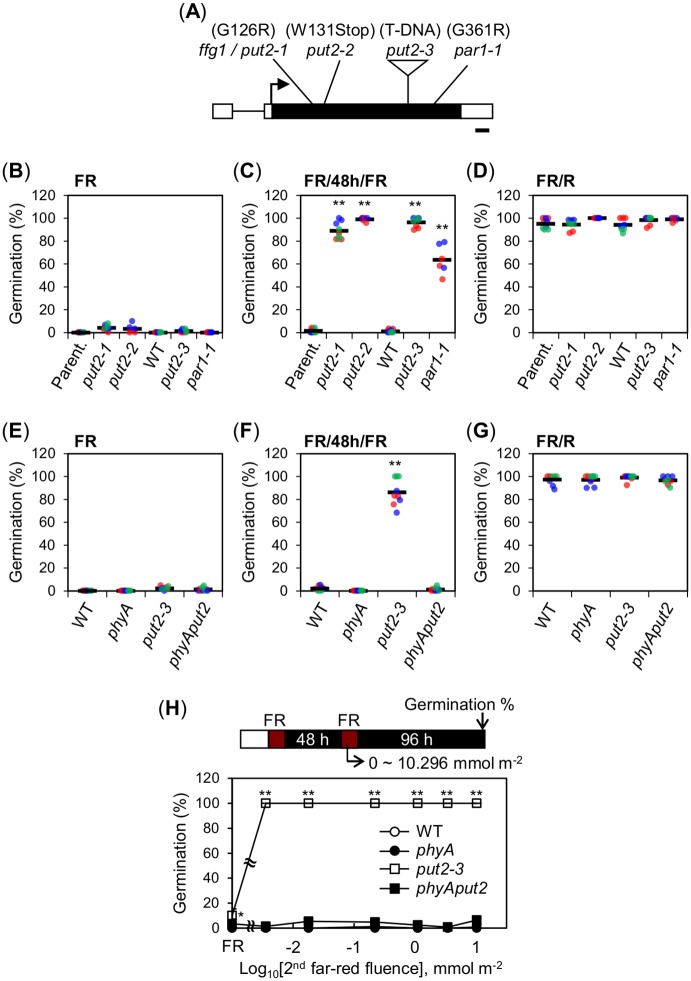
Fig 2. PUT2 encodes a negative regulator of phyA signaling in seeds.
(A) Diagram shows the genomic structure of the PUT2 gene and the different mutant alleles used in this study. Black box: exon, black line: intron, white boxes: UTRs and arrow: transcription start site. Bar: 100 bp. (B-D) Scatter dot plots show germination percentages of 18-month-old wild type (WT) and different put2 mutant seeds, alleles as indicated, exposed to a FR (B), FR/48h/FR (C) or FR/R assay (D). (E-G) Germination percentages of Col-0 (WT), phyA-211 (phyA), put2-3 and phyA-211put2-3 (phyAput2) seeds exposed to a FR (E), FR/48h/FR (F) or FR/R assay (G). (H) Graph shows germination percentages of WT, phyA, put2-3 and phyAput2 seeds exposed to a FR/48h/FR assay using different FR light fluences for the second FR pulse (0 to 10.296 mmol m-2). FR indicates FR assay (No second FR pulse). For (B-G) two or three independent biological replicates, depending on the genotype used, were used and are represented with an individual color each (red, blue or green). For each biological replicate, three technical repetitions of the germination percentage of 50–65 seeds are shown by a dot (red, blue or green). The average germination percentage for all the technical repetitions is represented by a horizontal black bar. For (H) three technical repetitions (n = 50–65 each) were used for SD. Statistical treatment as in Fig 1B. Experiment in (H) was repeated with one biological seed batch sample, which provided similar results.

