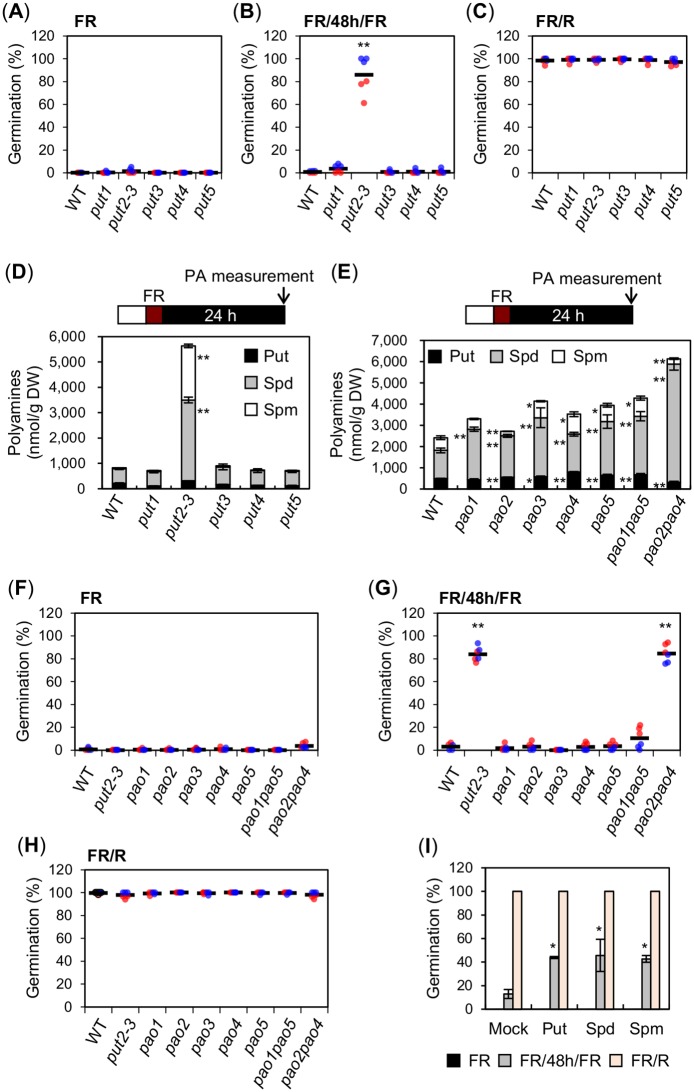
Fig 3. High PA levels are associated with enhanced phyA-mediated seed germination.
(A-C) Scatter dot plots show germination percentages of WT and put1—put5 seeds exposed to a FR (A), FR/48h/FR (B) or FR/R assay (C). (D) Free PA (Put, Spd and Spm) levels in WT and put1—put5 seeds exposed to a FR assay. PAs were measured 24 h after the FR pulse. (E) Free PA (Put, Spd and Spm) levels in WT, pao1—pao5, pao1pao5 and pao2pao4 seeds exposed to a FR assay. PAs were measured 24 h after the FR pulse. (F-H) Germination percentages of WT, put2-3, pao1—pao5, pao1pao5 and pao2pao4 seeds exposed to FR (F), FR/48h/FR (G) or FR/R assay (H). (I) Germination percentage of WT seeds exposed to a FR, FR/48h/FR or FR/R assay in germination plates containing 100 μM of individual PAs as indicated. For the germination assays in (I), two independent seed batch samples (biological replicates) were used. Germination percentage was assessed once with 50–65 seeds for each biological replicate and percentage values were used to calculate average germination percentage and SD. For the germination assays in (A-C) and (F-H), two independent biological replicates were used and are represented with an individual color each (red or blue). For each biological replicate, three technical repetitions of the germination percentage of 50–65 seeds are shown by a colored dot (red or blue). The average germination percentage for all the technical repetitions is represented by a horizontal black bar. For (D and E) three technical repetitions were used for SD (n = 3). Statistical treatment as in Fig 1B.

