Fig. 2.
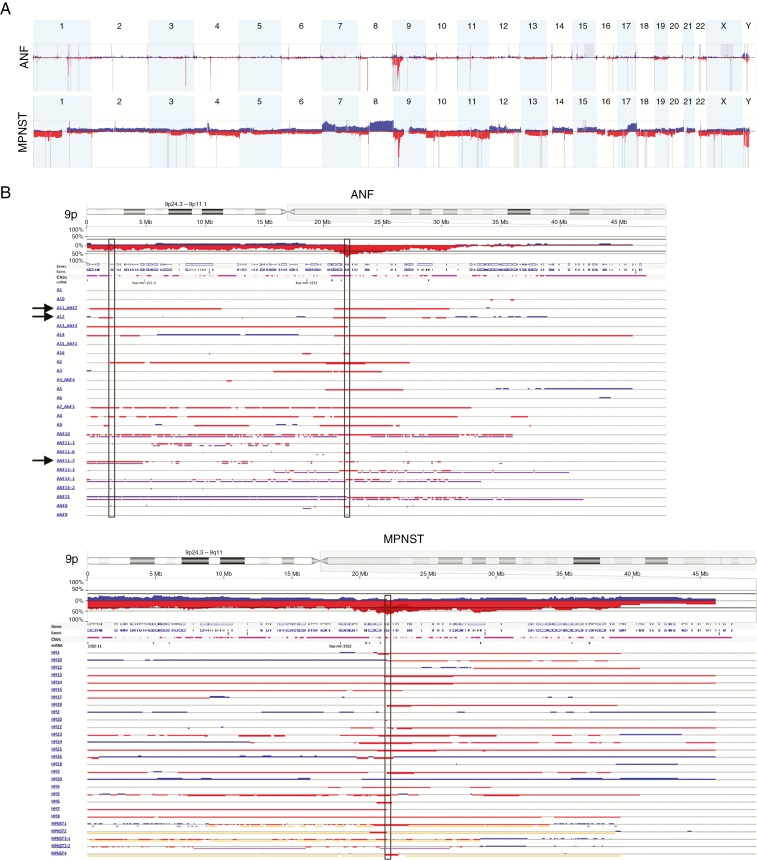
CNV in ANF and MPNST. (A) GISTIC analysis of 26 ANFs (upper panel) and 28 MPNSTs (lower panel). Gains and losses are shown in blue and red, respectively. Statistically significant CNVs (false discovery rate <0.25) are denoted with gray vertical bars. Chromosome numbers are shown on top of each panel. (B) CNV in chromosome 9p in 26 ANFs (left panel) and 28 MPNSTs (right panel). Gains and losses are shown in blue and red, respectively. Homozygous losses are shown in dark red and thick bars. Vertical rectangles in the center denote minimally overlapped regions in ANF and MPNST that both include the CDKN2A and CDKN2B genes. Left vertical rectangle in the ANF panel denotes SMARCA2. Arrows show samples (A11_ANF7, A12, ANF11-7) in which deletion of SMARCA2 is clearly independent from CDKN2A/B.

