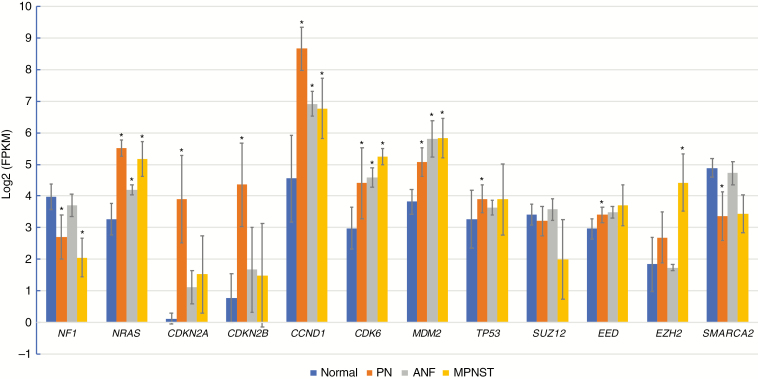
Fig. 3.
Expression of genes frequently affected by CNV/mutations, genes identified by GSEA leading edge analysis, and select biologically relevant genes in normal tissues (n = 39), PN (n = 23), ANF (n = 5), and MPNST (n = 5) as determined by RNAseq analysis. Expression values are shown in fragments per kilobase per million (FPKM) reads, log2 transformed, log2(FPKM) units. Blue, red, gray, and orange bars correspond to normal tissues, PN, ANF, and MPNST, respectively. Asterisks indicate statistically significant difference (by 2-tailed t-tests) between normal and PN, ANF, or MPNST expression values at P < 0.0001.

