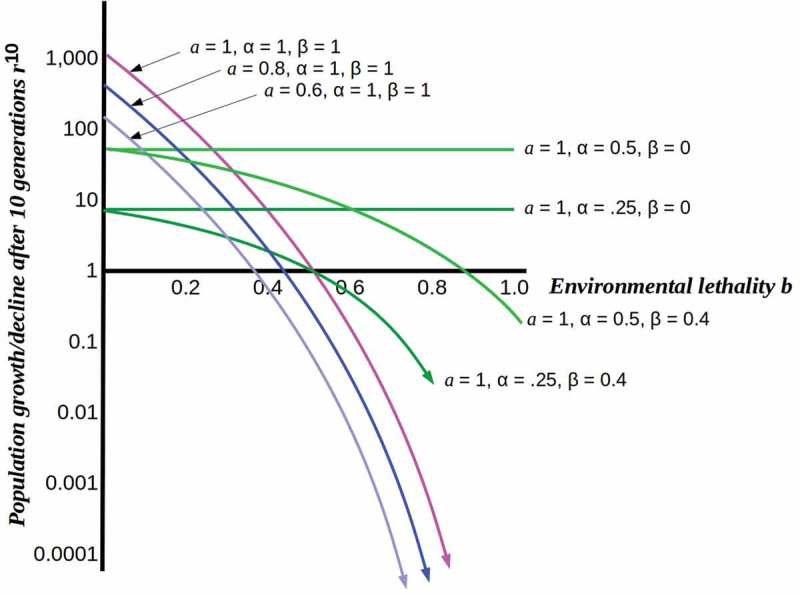
Figure 1.

Plots of population growth rn for n = 10 from a single initial cell as functions of environmental lethality b under different assumptions. Pink, blue and purple curves show the effect of decreasing resource levels on the rate of population collapse as lethality increases. Light and dark green curves show relative stability of fully (β = 0) or partially (β = 0.4) protected populations at different levels of resource-use efficiency.
