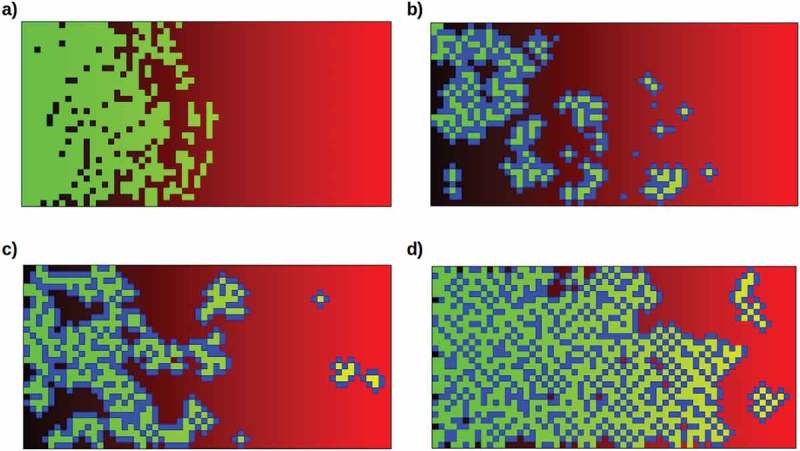
Figure 5.

Typical model simulation runs under different conditions. The simulation depicts an environment varying in lethality from 0% (b = 0, black, left margin) to 100% (b = 1.0, red, right margin). Stem cells (green) are randomly seeded in this environment at a density of 5% and allowed to reproduce for 120 division cycles. Neighboring stem cells compete for reproductive resources. Somatic progeny (blue) protect their nearest-neighboring cells, whether these are stem or other somatic cells. a) Stem cells alone cannot invade the higher-lethality half of the environment, even with optimal reproductive resources (a = 1.0). Here neighboring stem cells suffer a 20% resource reduction (α = 0.8) due to competition; removing this reduction does not allow them to cross the 50% lethality boundary. b) Moderately (50%, i.e. β’ = 0.5) protective but relatively long-lived (50% resistance to lethality) somatic cells allow mainly small colonies in the moderately-lethal (50% – 75%) sector of the environment (a = 0.8, probability of somatic-cell progeny 50%). c) Fully (100%, β’ = 0) protective but shorter-lived (only 20% resistance to lethality) somatic cells allow larger colonies to populate even the high-lethality (75% – 100%) sector of the environment (a = 0.8, probability of somatic-cell progeny 50%). d) Fully-protective and relatively long-lived (50% resistance to lethality) somatic cells allow invasion of the lethal sector of the environment (a = 1.0, probability of somatic-cell progeny 25%).
