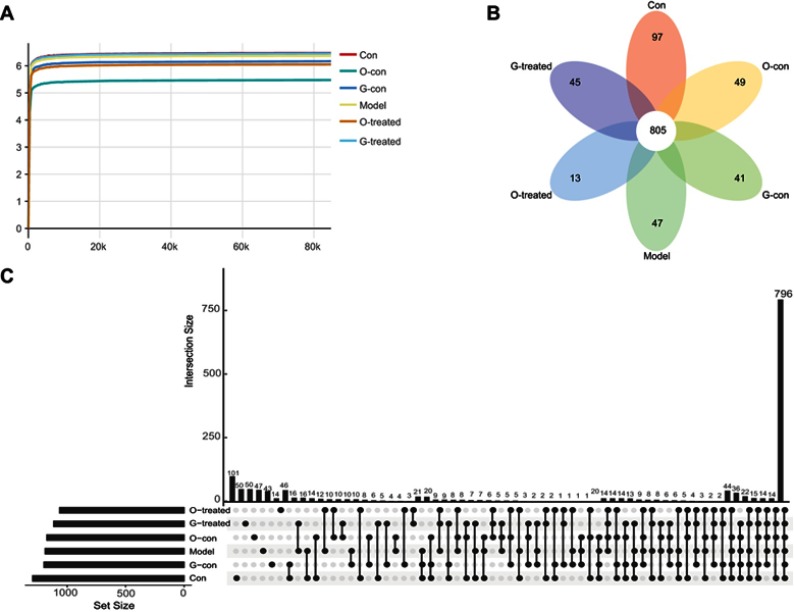
Figure 1.
Overview of the 16S rDNA gene analysis: (A) the Shannon rarefaction curves for each group and (B–C) the distribution of OTUs in the 6 groups.
Abbreviations: Con, normal control group; O-con, the ondansetron control group; G-con, the [6]-gingerol control group; Model, the cisplatin model group; O-treated, the ondansetron-treated model group; G-treated, the [6]-gingerol-treated model group; OTUs, operational taxonomic units.

