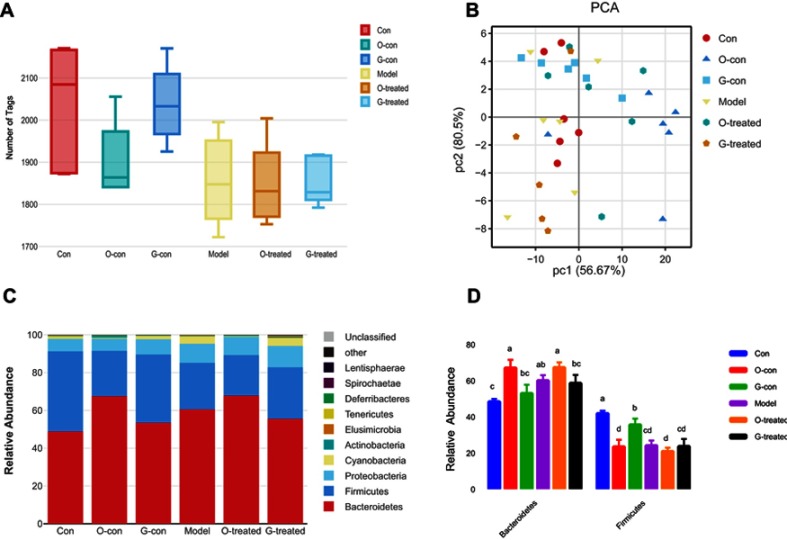
Figure 2.
The Unifrac analyses, relative abundances and heat map of the dominant bacterial communities of the gut microbiota in the 6 groups. (A–B) The Unifrac analyses, and (C–D) the relative abundances of the gut microbiota on the bacterial phylum level. Boxes with a different letter above the error bars were significantly different (P<0.05).
Abbreviations: Con, normal control group; O-con, the ondansetron control group; G-con, the [6]-gingerol control group; Model, the cisplatin model group; O-treated, the ondansetron-treated model group; G-treated, the [6]-gingerol-treated model group; OTUs, operational taxonomic units.

