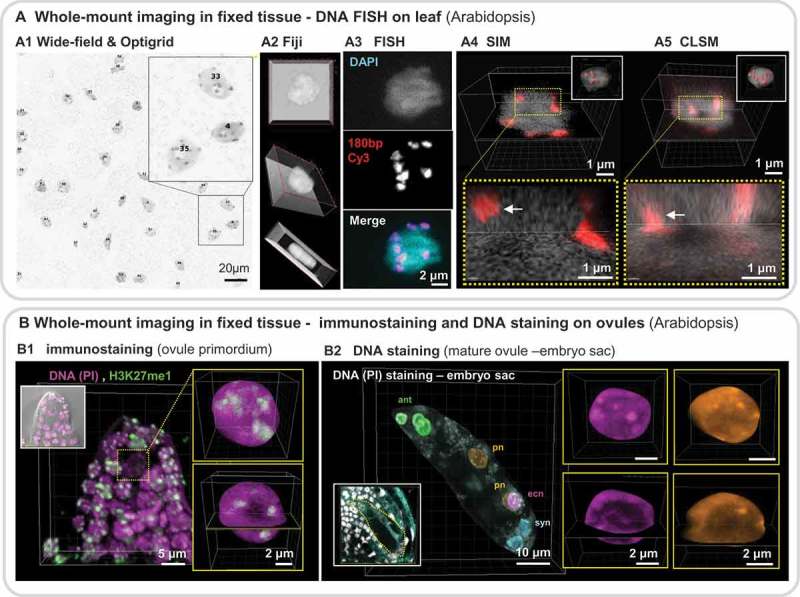
Figure 2.

Imaging plant nuclei in whole-mount fixed tissue.
Examples of imaging nuclei in 3D in whole-mount fixed tissues are shown for different nuclear fluorescent labeling: FISH, chromatin immunostaining, DNA staining. (a) Imaging nuclei in the leaf epidermis (Arabidopsis) at high resolution following DNA FISH. Overview of a leaf fragment, wide-field image stack of 6.5 µm2 (2048 x 2048 pixels) (a1) in transmission light. Nuclei are stained with DAPI, Close-up on subregions and individual nuclei. (a2) 3D projections using Fiji in a tripartite panel. (a3) Fluorescent In Situ Hybridization (FISH) decomposition into the individual DNA (DAPI) and FISH probe (180bp repeat oligo labeled with Cy3) and overlay (merge) – right panel. Comparison of image details obtained using structured illumination microscopy (SIM, Leica DM6000 & Optigrid, (a4) or confocal imaging (CLSM, Zeiss LSM800), (a5) of the same nucleus. The images show orthogonal slicers (top panel) and a close-up view (dotted yellow box, lower panel) showing the different resolution and image contrast, particularly at chromocenters (red). A 3D reconstruction with segmented nuclear surface (grey) and chromocenters (red) are shown as insets. Empowered by Imaris (Bitplane AG, CH). (b) Imaging nuclei in whole-mount ovules (Arabidopsis) at high resolution following immunostaining (b1) or DNA staining (b2). Ovule primordia (B1) or mature ovules (B2) were embedded in acrylamid, fixed, cleared, permeabilised, immunostained for a chromatin mark (H3K27me1, green, B1) and counterstained for DNA (PI, propidium iodide, magenta, B1) or stained for DNA only (PI, B2). Ovules were imaged by confocal microscopy (Leica SP2 and SP5, 63x Gly, NA 1.3) with 2–3-fold oversampling. The images were denoised but not deconvolved. b1 shows a max.projection (inset: overlay with the transmission DIC channel) and detail of the nucleus of the spore mother cell after 3D segmentation (yellow insets) as max.projection and with orthogonal slice views. This image quality allows for signal quantification and measurements of relative histone modification levels [91]. b2 shows a mature embryo sac before fusion of the polar nuclei (pn). The original image is shown in the inset (nuclei, grey. Reflection light, cyan). For this 3D representation, the embryo sac was manually segmented in 3D, as well as individual nuclei, to create 3D masks and corresponding channels identifying the polar nuclei (pn), egg cell nucleus (ecn), synergid nuclei (syn) and three antipodal nuclei (ant). Inerts on the right show max.projections and orthogonal sections of the ecn and one pn, showing high level of details in chromatin distribution.
