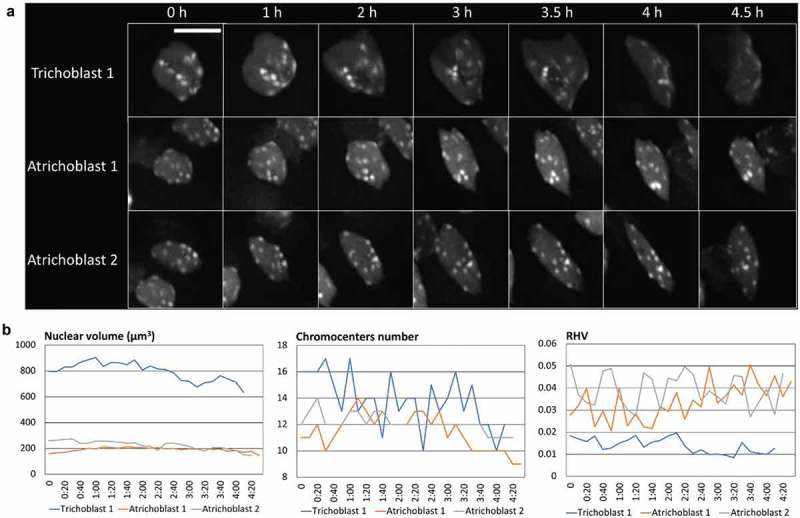
Figure 6.

Live-tracking nuclei using the TARDIS pipeline.
Growing, intact roots were mounted in physiological medium and imaged with a spinning disk microscope for 5 h. The field of view captured several nuclei, as shown in Figure 1(d). The TARDIS software allows for microscope stage repositioning and live nuclei tracking, facilitating downstream image processing aiming at capturing quantitative changes in nuclear organization. (a) Representative maximum intensity projection of three individual nuclei at indicated time points, scale bar = 10 µm. The last timepoint of trichoblast 1 correspond to 4 h 20 min. (b) Quantitative analysis of nuclear architecture: nuclear volume (left), chromocenter number (middle), and relative heterochromatin volume (RHV) measured from nuclei shown in (a) during the time-lapse experiment.
