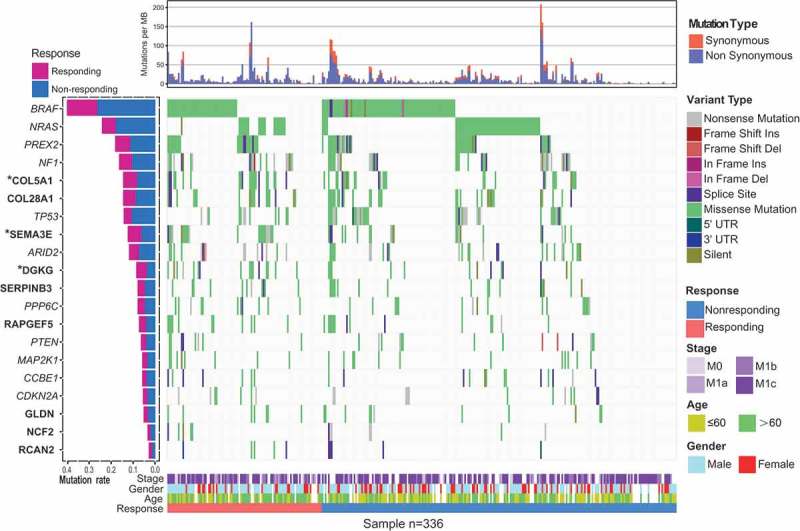
Figure 1.

Mutational landscape of significantly mutated genes (SMGs) of melanoma patients treated with ICB. The left panel is mutation frequency. Upper panel shows mutation load stratified by synonymous and non-synonymous mutations. Middle panel depicts mutation relation of SMGs across analyzed cases with mutation types color coded differently. Bottom panel displays clinical features such as immune response status, age, gender and stage. Prognosis-related SMGs were highlighted in bold and immune response-related genes are highlighted in upper left asterisk.
