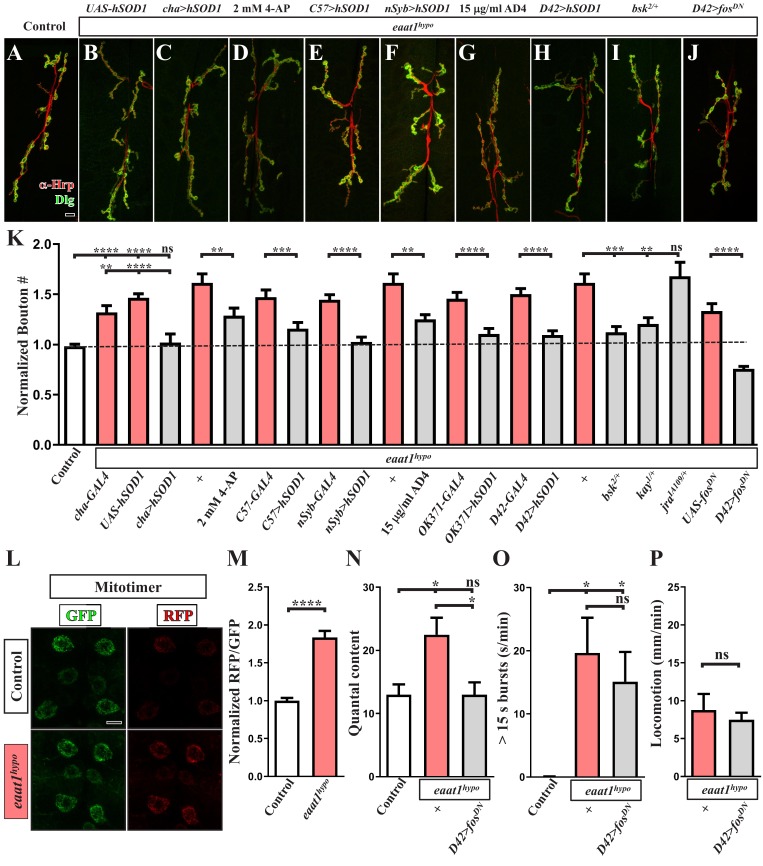
Figure 7. Premotor circuit dysfunction causes altered NMJ bouton architecture via ROS-dependent activation of the JNK signaling pathway upon loss of eaat1.
(A–J) Representative confocal images of NMJs co-stained with α-HRP (red) and α-Dlg (green) obtained from third instar larvae of controls (w1118) and the indicated genotypes. Scale bar: 10 µm. (K) Quantification data for the number of NMJ boutons per muscle area normalized to the value of controls (n ≥ 7 NMJs of A2 muscles 6 and 7 derived from n ≥ 7 animals for each genotype). (L–M) Loss of eaat1 increases mitochondrial ROS in motor neurons. (L) Representative confocal images of motor neurons of third instar larvae expressing mitotimer using D42-GAL4 obtained from controls (w1118) and eaat1hypo/hypo mutants. Scale bar: 5 µm. (M) The RFP/GFP ratio of mitotimer was quantified and normalized to the value of controls (n ≥ 10 animals for each genotype). (N,O) Expression of fosDN in motor neurons rescues the NMJ bouton phenotype based on normalized quantal content, but does not affect premotor circuit dysregulation in eaat1hypo mutants. (N) Quantification data for quantal content recorded from A3 muscle 6 of third instar larvae of controls (w1118) and the indicated genotypes with 0.2 Hz electric stimulation in 0.5 mM Ca2+-containing HL3 solution (n ≥ 6 animals for each genotype). (O) Quantification data for overall firing time (for bursts of >15 s) per recording minute (n ≥ 8 animals for each genotype). (P) Quantification data for larval locomotion of eaat1hypo mutants and eaat1hypo mutants who express fosDN in motor neurons (n ≥ 20 animals for each genotype). P values: ns, not significant; *, p<0.05; **, p<0.01; ***, p<0.001; ****, p<0.0001. n: replicate number. Error bars indicate SEM. Statistics: Student's t-test or one-way ANOVA with Tukey’s post hoc test.

