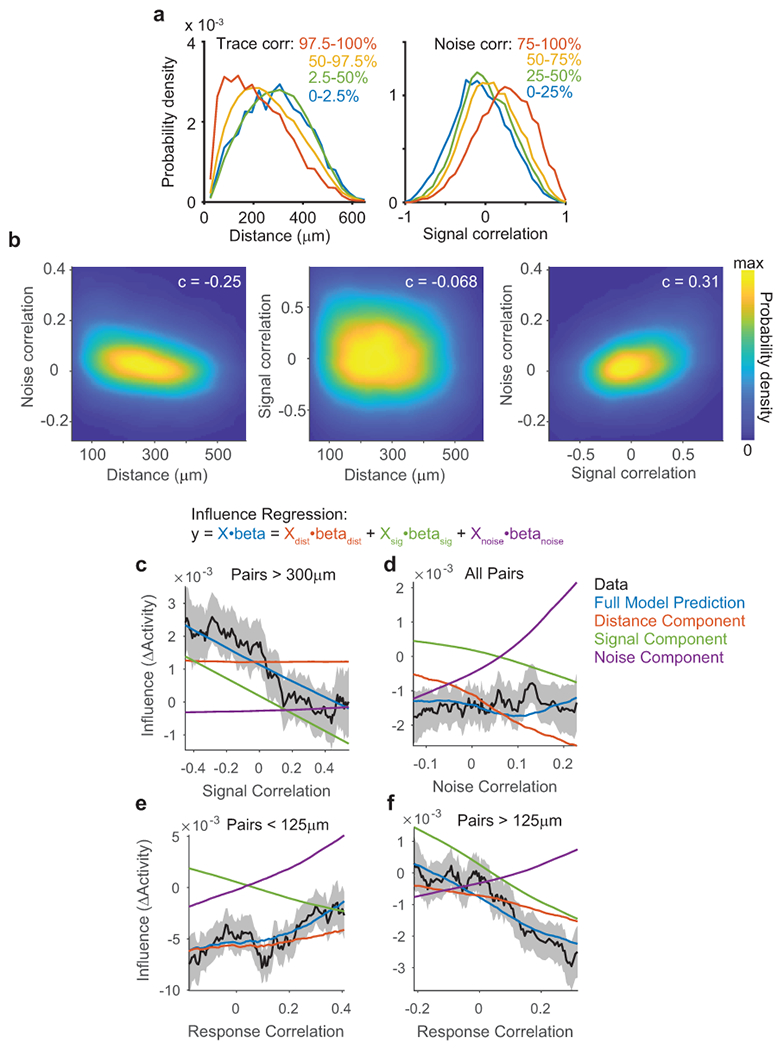
Extended Data Figure 6:

Influence regression separates contributions of correlated similarity metrics
(a) Probability density functions estimated by kernel smoothing for distance (left) and signal correlation (right), for all data used in influence regression (n = 64,485 pairs). Separate densities were estimated for pairs exhibiting varying trace correlation (left) or noise correlation (right). The plots show that pairs with high trace correlations occurred at all distances, but more often for nearby neurons. Similarly signal correlations for pairs with high versus low noise correlations were distinct but overlapping distributions. This highlights the importance and feasibility of influence regression to disambiguate the contributions of distance, signal, and noise correlation.
(b) Two-dimensional probability density functions for pairs of similarity metrics, estimated using kernel smoothing, for all data used in influence regression. Spearman correlation values for each pair of similarity metrics are overlaid. All correlations were significant with p < 1×10−60, n=64,845 pairs.
(c) Running average of influence data (black) and predictions (colored lines) from influence regression model, using a bin half-width of 15% (percentile bins). Dashed lines are mean ± sem of data by bootstrap. Signal correlation is plotted against mean influence, for the subset of pairs more than 300 μm apart. Model predictions are computed using a full influence regression model (blue), or using subsets of coefficients from the same model (distance-red, signal-green, noise-purple). The full model prediction is equal to the sum of the three components. The running average analysis here accurately reflects the signal component of the influence regression model, plus a tonic offset from the distance component.
(d) Running average as in (a), but for noise correlation and pairs at all distances. Note that signal and noise interaction coefficients with distance are included in signal and noise components, respectively. The running average analysis here confusingly indicates a flat slope of noise correlation and influence. Our model predicts this relationship because pairs with higher noise correlations were located at shorter distances, and also had increased signal correlations, and these effects together canceled out increases in influence due to noise correlation.
(e) Running average as in (a), but for model-free correlations of single-trial responses, and for pairs separated by less than 125 μm. At short distances, the positive effect of noise correlations dominated the negative effect of signal correlations.
(f) Running average as in (a), but for model-free correlations of single-trial responses, and for pairs separated by more than 125 μm. At long distances, the negative effect of signal correlations dominated the positive effect of noise correlations.
