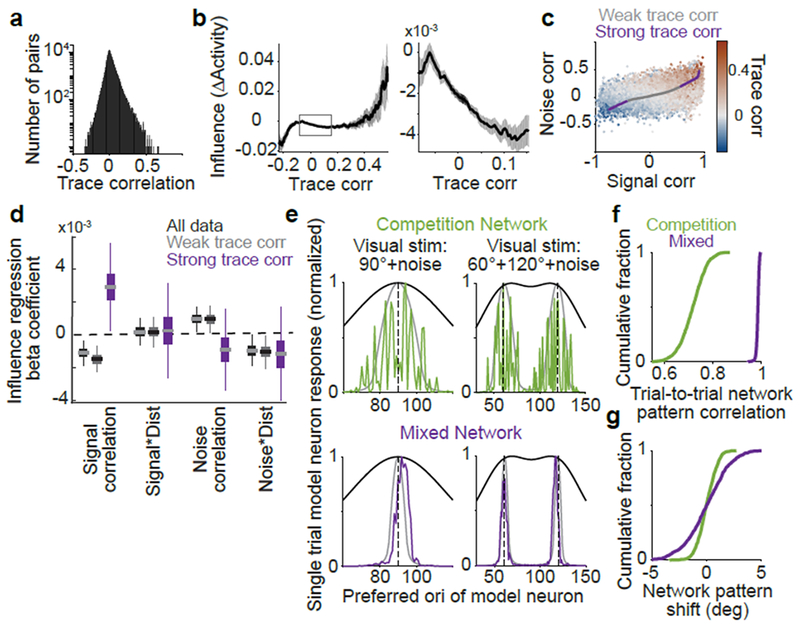
Figure 5:

Strongly-correlated pairs exhibit non-competitive influence
(a) Histogram of trace correlations.
(b) Influence vs. trace correlation. Bin half-width, 0.1. Right: zoom on central 95% of trace correlations. Shading, mean ± sem (bootstrap), n=153,689 pairs.
(c) Signal and noise correlations colored by trace correlation. Line, average signal and noise correlations for the trace correlation bins in (b), colored by weak (central 95%) or strong (top, bottom 2.5%) trace correlations. Trace correlation is related, but not identical to, the sum of signal and noise correlations.
(d) Influence regression coefficients, as in Figure 3e. All data, black; pairs with weak (gray) or strong (purple) trace correlations. Distance predictors were included (not shown, see Extended Data Fig. 10). For strong trace correlations: signal correlation, p = 0.011 (bootstrap), n = 3,242 pairs; other coefficients, p > 0.32.
(e) Single trial rate-network model neuron responses to a 90 degree stimulus (left) or sum of 60 and 120 degree stimuli (right), with noisy inputs. Gray lines, responses without added noise. Black lines, feedforward inputs (without noise).
(f) Cross-correlation of single-trial responses on 1000 simulated noisy trials to the noiseless response (maximum value over all shifts in orientation).
(g) As in (f), but for the shift in network response due to noise in the input (orientation center-of-mass of activity relative to the noiseless response).
