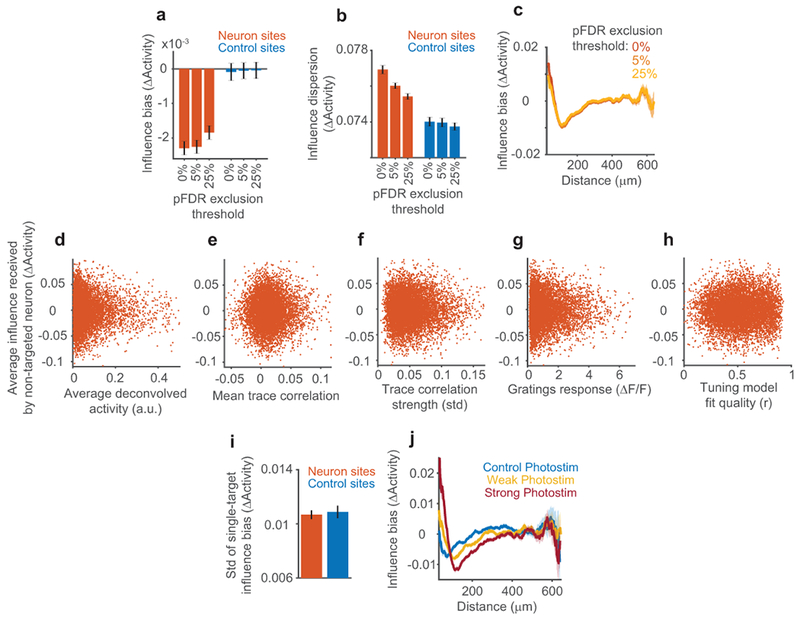
Extended Data Figure 3:

Extended comparison of photostimulation of neuron sites and control sites.
(a) Influence bias (mean ΔActivity) comparison between neuron and control site photostimulation, after exclusion of pairs with individually significant influence values. Significance of each individual pair’s influence was determined with a non-parametric bootstrap (Extended Data Fig. 3, Methods), and a p-value threshold for significance was chosen to restrict the fraction of false positives below 5% or 25% (pFDR, Methods). For 0%, n=153,689 neuron and 90,705 control pairs. 225 neuron and 26 control pairs were excluded for 5% pFDR, 638 neuron and 50 control pairs were excluded for 25% pFDR. Influence following neuron photostimulation was significantly negative for all thresholds, Mann-Whitney U-test, 0% p = 8.90 × 10⁻¹⁶, 5% p = 7.24 × 10⁻¹⁵, 25% p = 5.72 × 10⁻¹².
(b) As in (a) but for influence dispersion (std of ΔActivity). Influence dispersion was greater following neuron than control photostimulation for all thresholds, two-sample F-test, 0% p = 6.84 × 10−39, 5% p = 6.04 × 10⁻²⁰, 25% p = 2.63 × 10⁻¹⁴.
(c) As in (a-b), but for influence bias as a function of distance. A quantitatively similar center-surround pattern was observed for all thresholds.
(d) Average influence values for a non-targeted neuron (over all photostimulated neurons) vs. that neuron’s average deconvolved activity during non-photostimulated trials in influence mapping blocks. Each dot is a single non-targeted neuron. n = 8552 neurons. Spearman correlation, c = −0.00003, p = 0.99.
(e) Same as in (c), except for mean trace correlation during tuning measurement blocks. c = 0.0068, p = 0.53.
(f) Same as in (d), except for trace correlation strength. c = 0.0099, p = 0.36.
(g) Same as in (d), except for gratings response. c = 0.0092, p = 0.38.
(h) Same as in (d), except for GP tuning model fit quality. c = 0.011, p = 0.29.
(i) The mean influence for all values for a single-target was calculated. The standard deviation of these values for neuron sites and control sites is plotted. The similar values indicate that it is unlikely that some neurons tended to have much larger positive or negative influence than expected based random sampling of the group mean (which was lower for neuron than control sites, see Fig. 2). Error bars, mean ± sem across targets. n = 518 neuron targets, 295 control targets, p = 0.72, two-sample F-test.
(j) Running average of influence with pairwise distance using bin half-width of 30 μm. Shading corresponds to mean ± sem calculated by bootstrap. Data are divided into influence from photostimulation sites with stronger versus weaker direct photostimulation responses in the targeted neuron, using a median split of photostimulation significance, as well as for control site photostimulation. Mean photostimulation response was 0.36 ΔF/F and 0.85 ΔF/F for weak and strong groups. Note the weak distance-dependence observed for control site photostimulation is consistent with greatly reduced, but non-zero, neural excitation when targeting control sites. This may result from a number of factors including suboptimal resolution and brain movement in vivo, and indicates the necessity of control site photostimulation.
