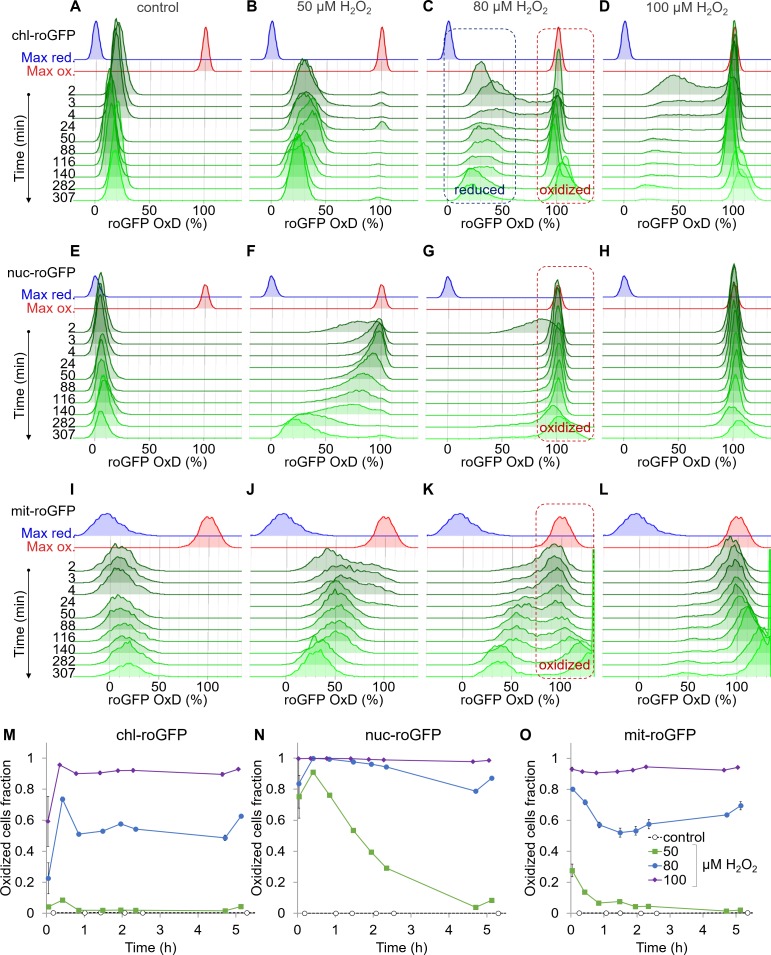
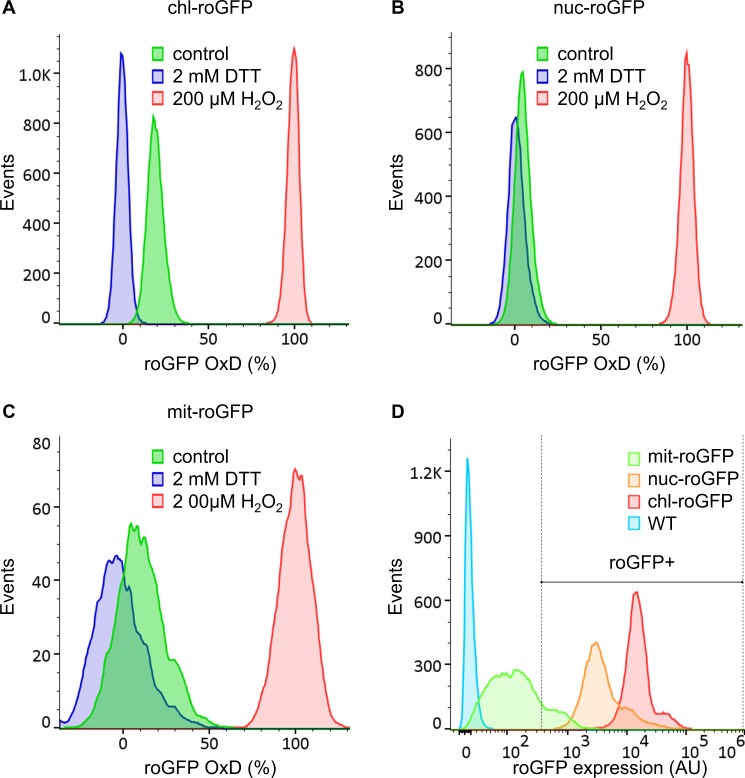
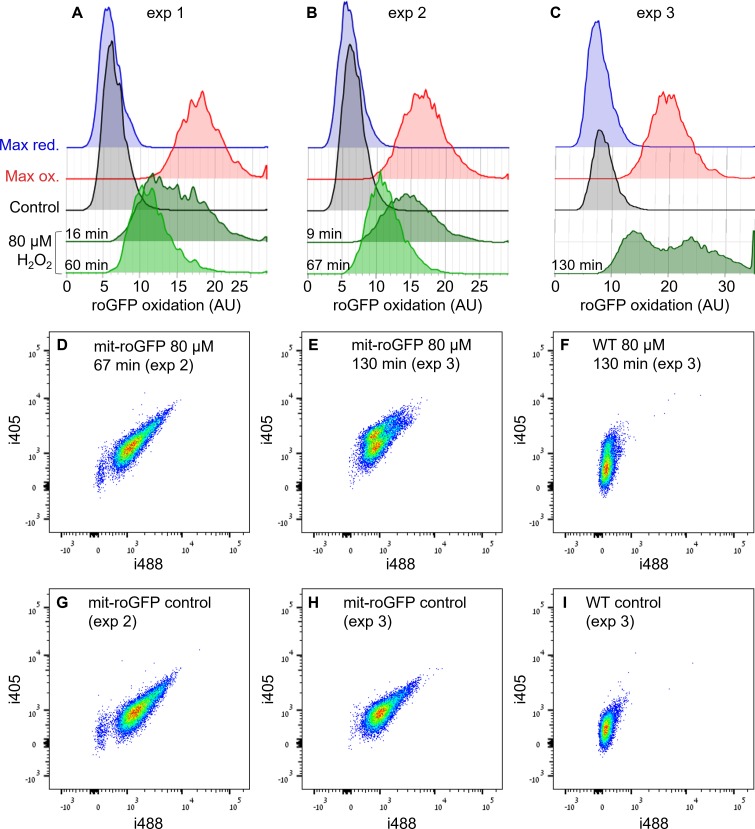
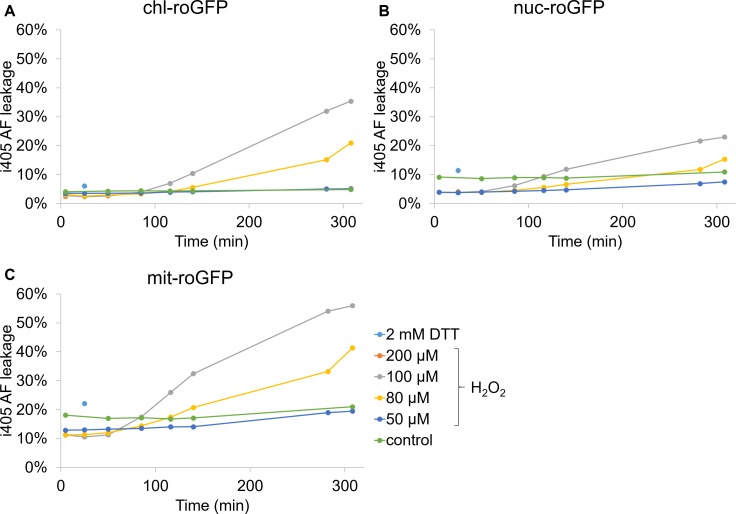
Figure 2. Organelle-specific oxidation of roGFP in response to H2O2 reveals heterogeneity at the single-cell level.
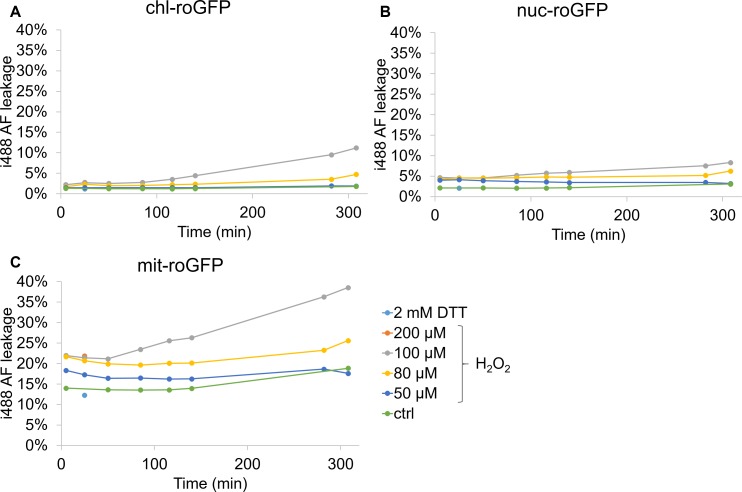
The distribution of roGFP OxD in the population over time was measured by flow cytometry in P. tricornutum cells expressing roGFP targeted to the chloroplast (chl-roGFP, (A–D, M)), nucleus (nuc-roGFP, (E–H, N)) and mitochondria (mit-roGFP, (I–L, O)). (A–L) Oxidation of roGFP in response to 0 µM (A,E,I), 50 µM (B,F,J), 80 µM (C,G,K), and 100 µM (D,H,L) H2O2. Maximum reduction (blue) and oxidation (red) of roGFP following additions of 2 mM Dithiothreitol (DTT) or 200 µM H2O2 respectively are shown as a reference. The ‘oxidized’ and ‘reduced’ subpopulations are marked by red and blue dashed boxes respectively (C, G, K). The experiment was done in triplicates, for visualization the first replica is shown except for the first 4 min in which all replicates are shown for higher temporal resolution. Each histogram consists of >8000 (A–D), >5900 (E–H) and >1400 (I–L) roGFP-positive cells. Measurements of >100% OxD may result from increased auto-fluorescence leakage after long exposure to stress (Figure 2—figure supplements 5–6). (M–O) The fraction of the ‘oxidized’ subpopulation over time upon exposure to 0–100 µM H2O2. Mean ± SEM, n = 3 biological repeats. SEM lower than 0.018 are not shown.

