. 2019 Jun 24;8:e47732. doi: 10.7554/eLife.47732

Figure 3. Early oxidation of chl-roGFP in a subpopulation precedes the induction of cell death.

(A) The fraction of dead cells measured by Sytox positive staining 24 hr post 50–200 H2O2 treatment as a function of the fraction of chl-roGFP ‘oxidized’ cells 1–2 hr post treatment (see Figure 2C). N ≥ 3 biological repeats per treatment, individual samples are shown, data of 5 independent experiments. Linear model is shown with 95% confidence interval in gray, formula: y = 1.09x-0.16, R2 = 0.89. (B) Colony forming units (CFU) survival of individual cells that were sorted into fresh media for regrowth based on their chl-roGFP oxidation at different times following treatment with 80 µM H2O2. Control – untreated chl-roGFP positive cells that were sorted regardless of degree of oxidation. CFU % survival was measured by the number of CFU divided by the number of sorted cells. N ≥ 6 biological repeats, individual repeats are shown, each of 24–48 separately sorted single cells. Oxidized – red circles; reduced – blue triangles; control – gray triangles. *** – p<0.001; ns – non-significant.

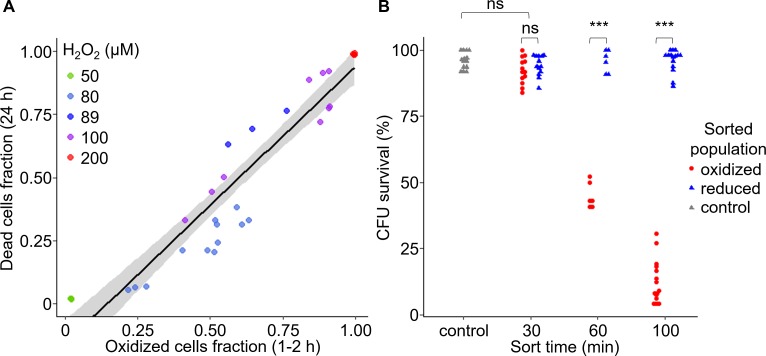
Figure 3—source data 1. Early chl-roGFP oxidation and subsequent cell death in response to H2O2.
DOI: 10.7554/eLife.47732.016
Figure 3—source data 2. Colony forming units single-cell survival of subpopulations following H2O2 treatment and sorting.
DOI: 10.7554/eLife.47732.017

Figure 3.

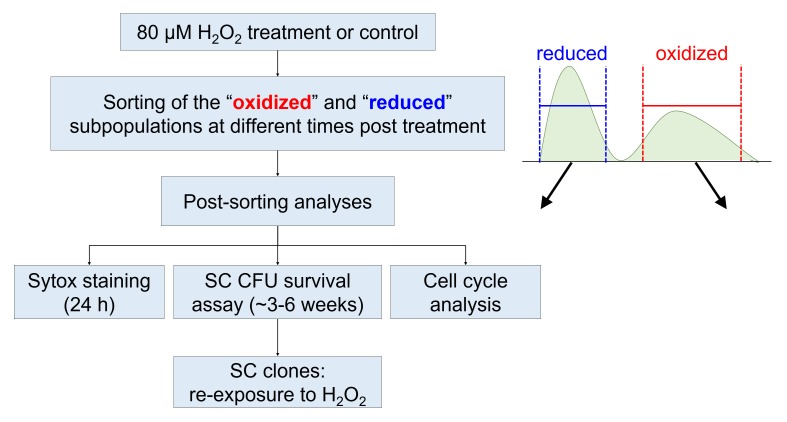
Figure 3—figure supplement 1. Schematic representation of sorting experiments layout and post-sorting analyses.

Figure 3—figure supplement 1.

Cells were treated with 80 µM H2O2, and then sorted based on chl-roGFP oxidation for different post-sorting analyses. Untreated control chl-roGFP positive cells were sorted regardless of degree of oxidation. SC – single-cell. CFU – colony forming units.
Figure 3—figure supplement 2. Mortality of sorted subpopulations following H2O2 treatment.

Figure 3—figure supplement 2.

Cell death was measured using Sytox staining 24 hr post sorting of enriched ‘oxidized’ and ‘reduced’ subpopulations or untreated control (see Materials and methods). Subpopulations were sorted 112 min post 80 µM H2O2 treatment. Data is shown as mean ± SEM, n = 3 biological repeats, each consists of >3700 cells. (***) p<0.001; (ns) non-significant (p=0.73), Tukey test.