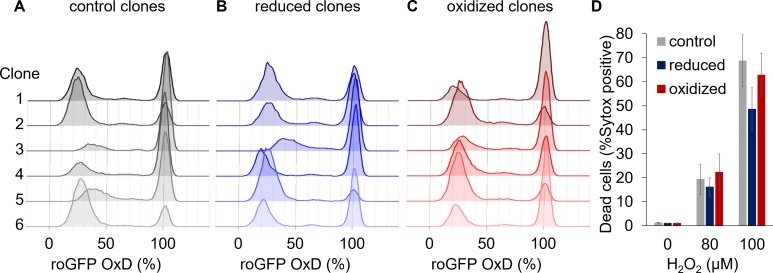
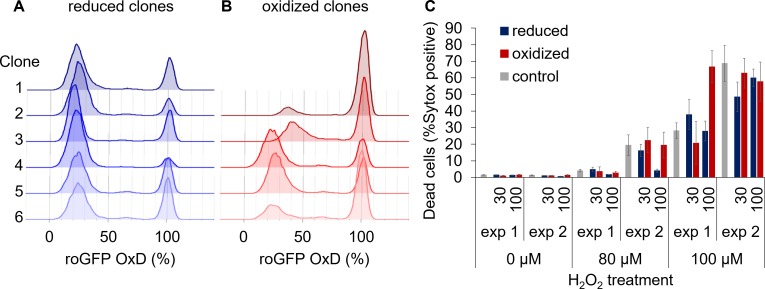
Figure 5. Clonal populations derived from sorted cells maintain the bi-stable phenotype of chl-roGFP response to H2O2.
(A–C) The distribution of chl-roGFP OxD (%) 40–45 min post 80 µM H2O2 treatment in clonal populations derived from sorted single cells of different origins, 3 weeks post sorting. The ‘reduced’ (B) and ‘oxidized’ (C) subpopulations were sorted 30 min post 80 µM H2O2 treatment based on chl-roGFP oxidation (Figure 3—figure supplement 1); ‘control’ (A) – clones of untreated cells that were sorted based on positive roGFP fluorescence. Each histogram is of a single clone,≥9900 cells per histogram, six representative clones per group are shown. (D) The fraction of dead cells 24 hr post H2O2 treatment of the different clones shown in (A–C) as measured by positive Sytox staining. Data is shown as mean ± SEM, n = 6 clones per group per treatment.


