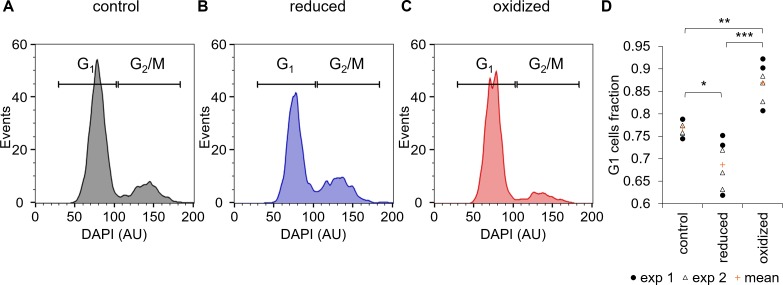
Figure 6. Cell cycle analysis of sorted ‘reduced’ and ‘oxidized’ subpopulations.
(A–C) Cell cycle analysis of FACS sorted control untreated cells (A) and of ‘reduced’ (B) and ‘oxidized’ (C) subpopulations that were sorted 30 min post 80 µM H2O2 treatment, based on chl-roGFP OxD. DAPI staining was used for DNA content quantification, gates used to discriminate G1 (two genome copies) and G2/M (four copies) are marked. (D) Fraction of cells within the G1 gate (marked in A-C) in sorted subpopulations. Data points of n = 6 biological repeats of 2 independent experiments (exp 1 and 2 marked with circles and triangles respectively) and the mean (orange plus sign) are shown, 1200–2000 cells analyzed per sample. P-values: *=0.011, **=0.0024, ***=0.0001. Tukey test was used for comparisons with control, paired t-test was used for comparing ‘reduced’ and ‘oxidized’ subpopulations.

