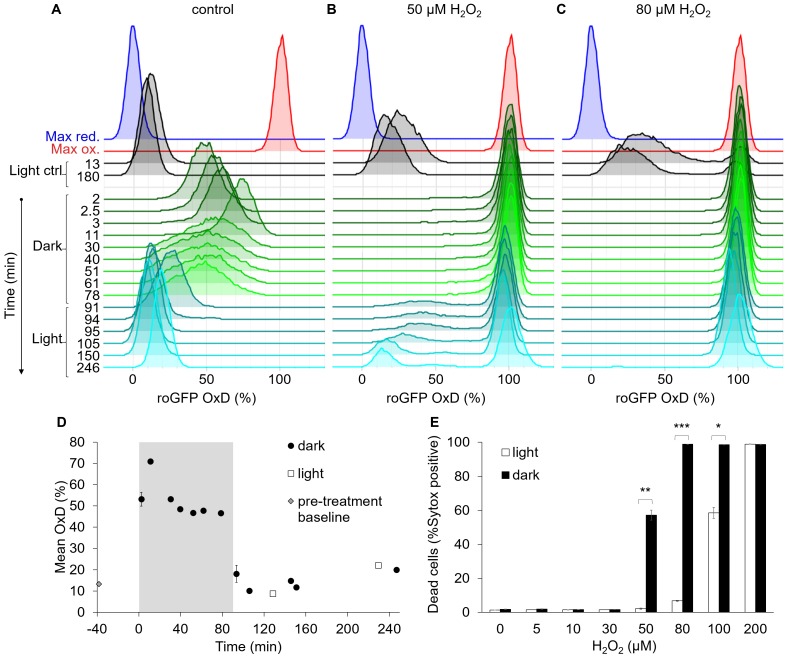
Figure 7. The bimodal chl-roGFP oxidation in response to H2O2 is light-dependent.
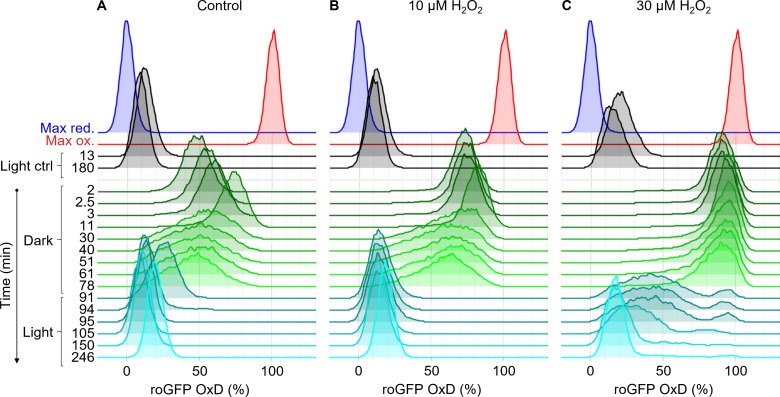
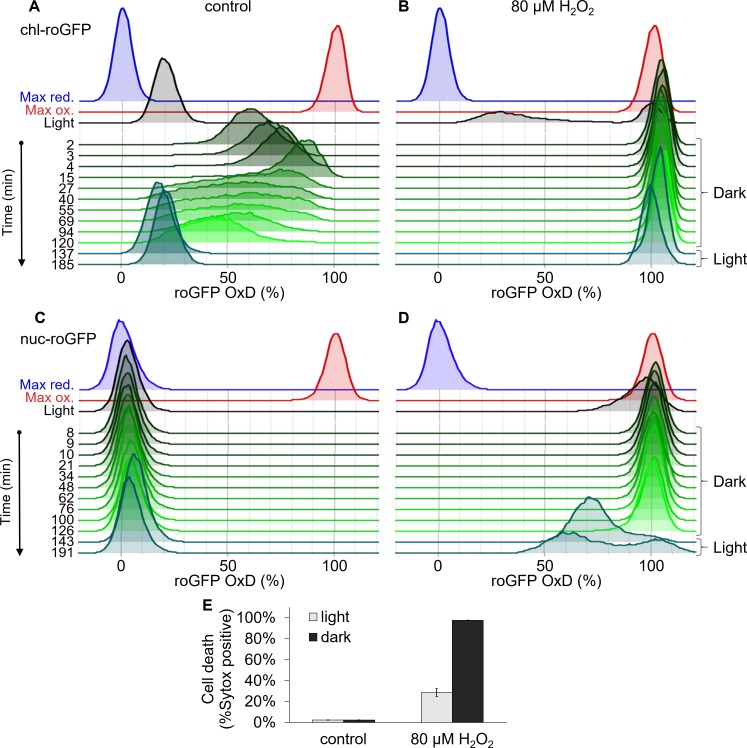
The effects of a short exposure to darkness during daytime on chl-roGFP oxidation patterns were examined. (A–C) Flow cytometry measurements of chl-roGFP OxD distribution in the population over time. Cells were treated with 0 µM (control, A), 50 µM (B), and 80 µM H2O2 (C), and were then transitioned to the dark at time 0 (within 5 min post H2O2 treatment). Cells were kept in the dark for 90 min (green) and were then transferred back to the light (cyan). The same H2O2 treatment without transition to the dark (light ctrl, black) and maximum oxidation (200 µM H2O2, red) and reduction (2 mM DTT, blue) are shown for reference. The experiment was done in triplicates that were highly similar, for visualization the first replica is shown. Each histogram consists of >8000 cells. (D) Mean ± SEM basal (control) chl-roGFP OxD over time of cells transitioned to the dark for 90 min (gray box) at time 0 (‘dark’) and cells kept in light conditions (‘light’), n = 3 biological repeats. Pre-treatment baseline under light conditions is shown. SEM lower than 0.5% are not shown. (E) The fraction of dead cells 24 hr post H2O2 treatment, with or without transition to the dark (‘dark’ and ‘light’ respectively), as measured by positive Sytox staining. Data is shown as mean ± SEM, n = 3 biological repeats. P values: *=0.0064, **=0.0026, ***=2·10−5, t-test.


