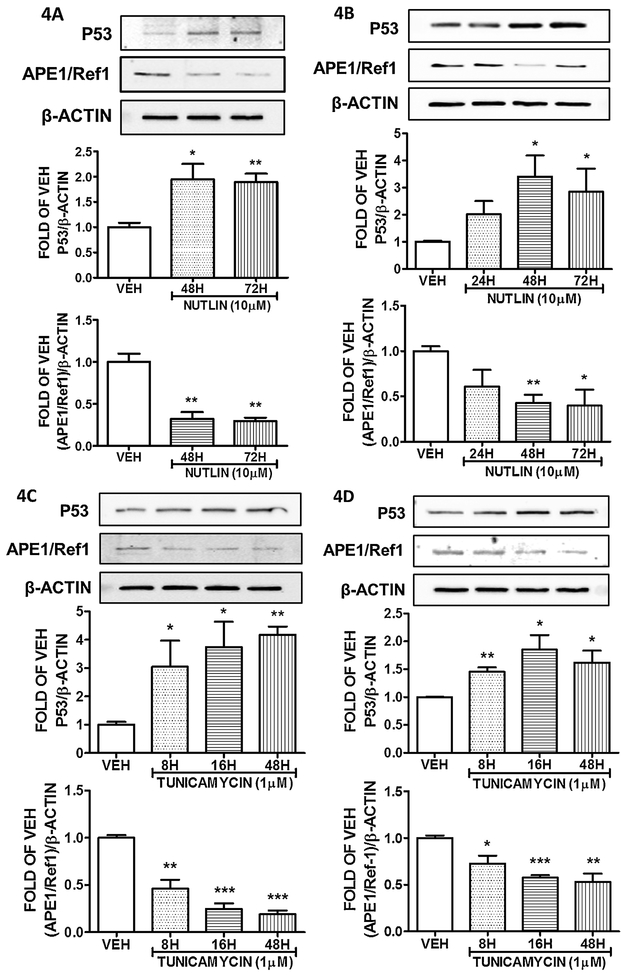
Figure 4: Induction of P53 suppresses APE1/Ref1 in lung endothelium cells.
(A) Western Blot analysis of P53, APE1/Ref1 and β actin after treatment of BPAEC with vehicle (DMSO) or Nutlin (10μM) for 48 and 72 hours. (B) Western Blot analysis of P53, APE1/Ref1 and β actin after treatment of HULEC-5a with vehicle (DMSO) or Nutlin (10μM) for 24, 48 and 72 hours. (C) Western Blot analysis of P53, APE1/Ref1 and β actin after treatment of BPAEC with vehicle (DMSO) or Tunicamycin (1μM) for 8, 16 and 48 hours. (D) Western Blot analysis of P53, APE1/Ref1 and β actin after treatment of HULEC-5a with vehicle (DMSO) or Tunicamycin (1μM) for 8, 16 and 48 hours. The blots shown are representative of 3 independent experiments. The signal intensity of the P53 and APE1/Ref1 bands were analyzed by densitometry. Protein levels were normalized to β actin. *P<0.05, **P<0.01, ***P<0.001 vs vehicle. Means ± SEM.

