
Figure 4.
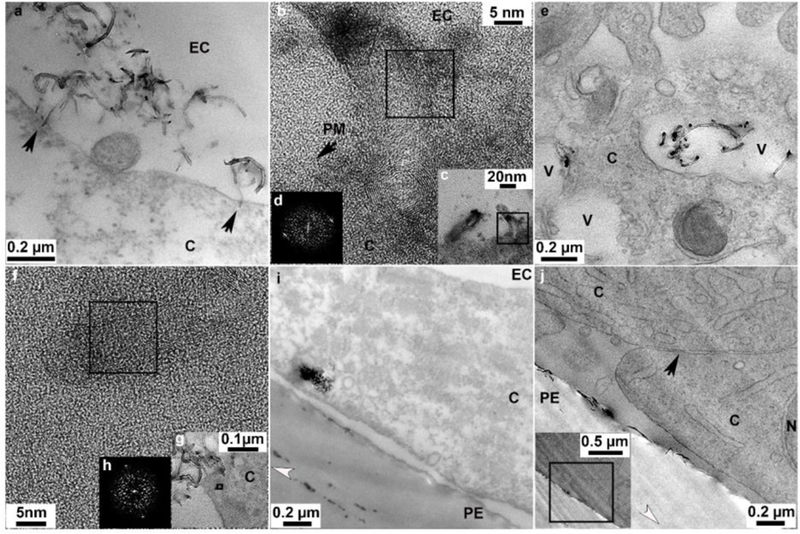
Uptake and cellular distribution of p(4VP)-MWCNTs within TT1 cells. (a) 700nm p(4VP)-MWCNTs aligned at 90° toward the plasma membrane (arrows) and inserted into the plasma membrane. (b) An HR-TEM image shows 300nm 4VP-MWNCTs penetrated the plasma membrane (PM). (c) Low magnification image of panel b. (d) Fast fourier transform (FFT) of the boxed region on panel b shows crystalline p(4VP)-MWCNT. (e) Individual and aggregated 300nm p(4VP)-MWCNTs inside vesicles within the cell. (f) HR-TEM image of an individual 300nm p(4VP)-MWCNTs within the cell cytoplasm; (g) Low magnification image of panel f. (h) FFT of the boxed region, (h) in panel f shows crystalline p(4VP)-MWCNTs within the cell. (i) Aggregates of 300 nm p(4VP)-MWCNTs at the basal side of the TT1 cell monolayer. (j) 300nm p(4VP)-MWCNTs at cell basal side beyond the cellular tight junction; the insert is the low magnification image of panel j. The black arrow in panel j indicates a tight junction. EC, N, V, C and PE denote extracellular region, cell nucleus, vesicles, cytosol and polyester membrane support, respectively. The white arrow heads indicate knife marks and show the cutting direction.