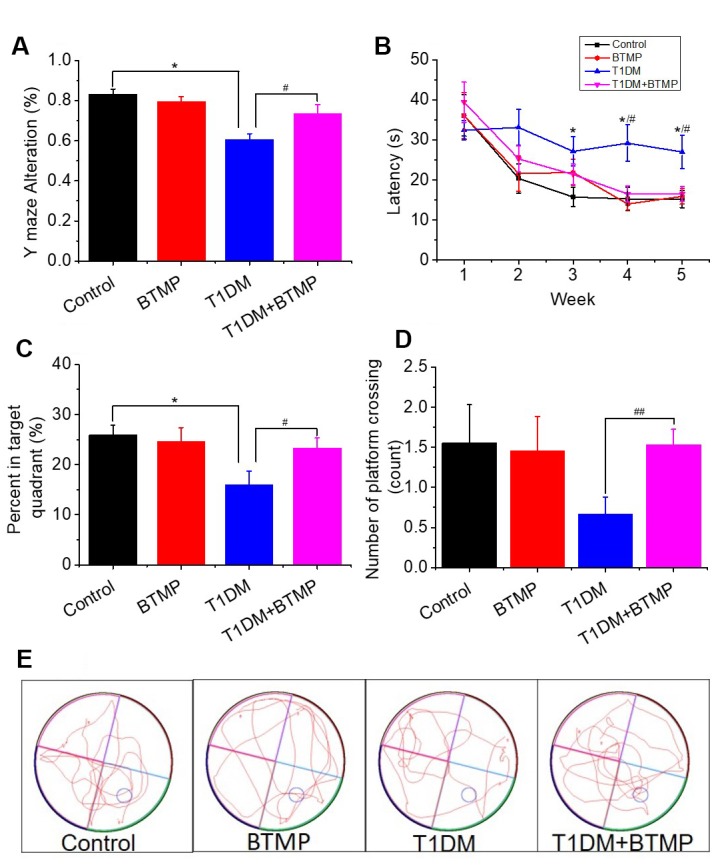
Figure 3.

Rescue of spatial learning and memory abilities in T1DM rats with BTMP. Animal groups and treatments were as described in Figure 2 except that rats were subjected to Y maze and Morris water maze tests. The accuracy of Y maze alternation was detected (panel A). The escape latency (panel B), percentage of time spent in the target quadrant (panel C) and number of platform crossings (panel D) were recorded. Representative images of the performance path are shown (panel E). “*” represents the difference between the Control and T1DM groups. “#” represents the difference between the T1DM and T1DM+benfotiamine (BTMP) groups. The number of those groups are control (n=10), BTMP (n=9), T1DM (n=15) and T1DM+BTMP (n=15). All values are expressed as the mean ± S.E.M. *, P < 0.05; #, P < 0.05; ##, P < 0.01.
