
Fig. 4.
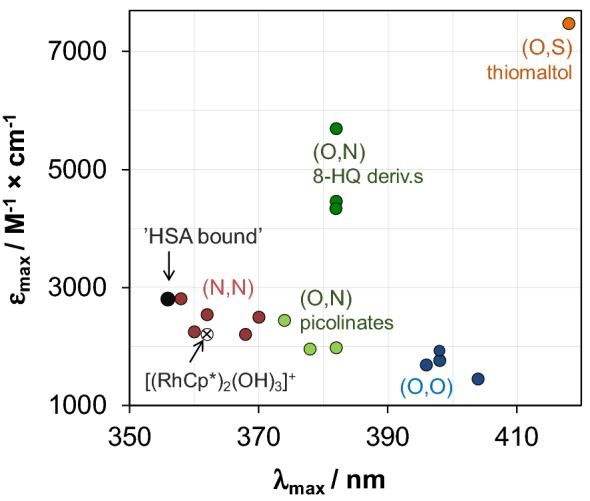
Correlation diagram for the λmax and εmax values of various bidentate [RhCp*(L)Cl] complexes and dimeric hydroxido species [(RhCp*)2(μ-OH)3]+ and HSA-bound RhCp* at 1:1 HSA-to-Rh ratio (correlation diagram for the aqua complexes ([RhCp*(L)(H2O)]) are presented in Fig. S3; see exact values for each complexes in Table S2)