
Fig. 8.
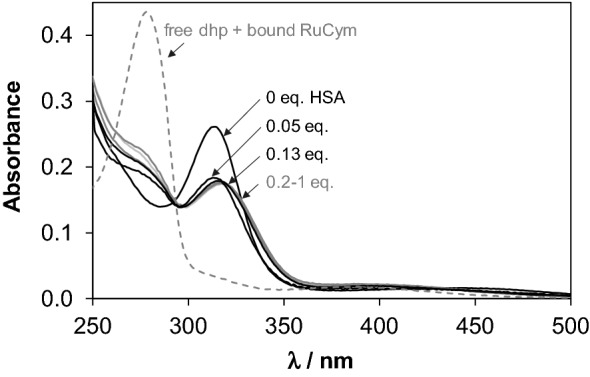
UV–Vis absorbance spectra of RuCym(dhp) in the absence and presence of various eq of HSA indicated in the figure. Dashed spectrum was calculated as sum of free dhp and HSA-bound organoruthenium ion. Spectra are subtracted by the spectrum of HSA [ccomplex = 29 μM, PBS′, 25 °C]