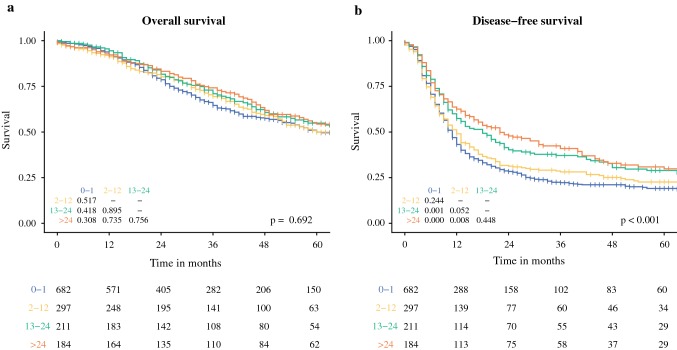
Fig. 1.
Kaplan–Meier survival curves for (a) overall survival and (b) disease-free survival stratified by the disease-free interval (months). The overall p value is displayed in the bottom right-hand corner of each graph; p values of the pairwise comparison of individual strata are reported in the left-hand corner; and the numbers at risk per stratum are reported in the table below the graphs

