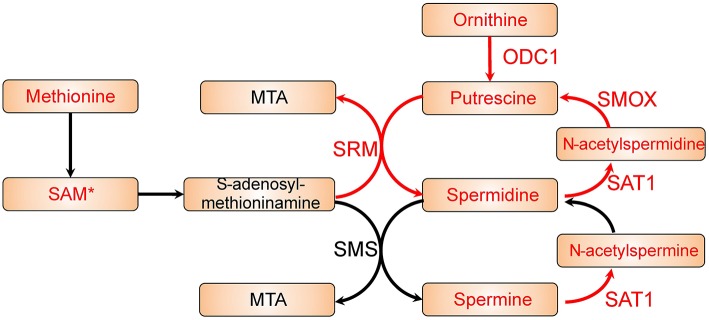
Figure 2.
Polyamine metabolic pathway with differential expression genes and reporter metabolites highlighted. Metabolites are shown as bricks and reporter metabolites are highlighted in red. Arrows represent metabolic reactions, and the genes related to the reactions are annotated closely to the arrows. The genes in red are significantly up-regulated in the differential expression analysis, and the reporter metabolites and genes with a star are border line significant (FDR ~ 0.1).

