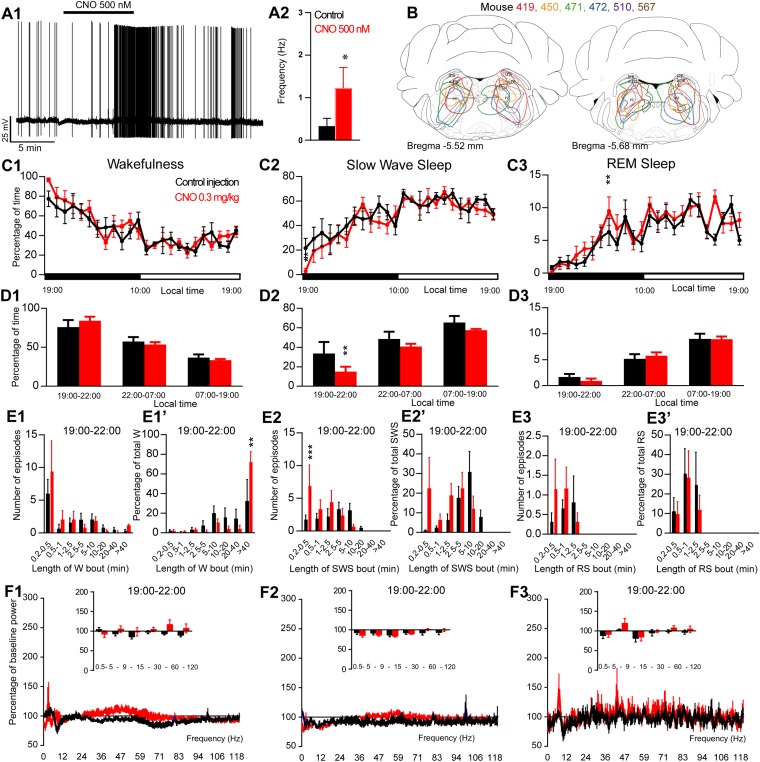
FIGURE 1.
Activation of PZ glutamatergic neurons during the active period (19:00 or ZT12). (A) In vitro confirmation. (A1) PZVglut2–hM3Dq whole-cell recording showing an increase in firing frequency in response to bath application of CNO (0.5 μM). (A2) Average firing frequency (±S.E.M.) during the last 2 min of the CNO (0.5 μM) application as compared with the 2 min period preceding CNO application (control; N = 5 PZVglut2–hM3Dq neurons). *p < 0.05 Paired Student’s t-tests. (B) Extent of transduced neurons (mCherry-positive somas) is shown for individual Vglut2-IRES-cre mice that received bilateral injections of hM3Dq-mCherry-AAV into the PZ (PZVglut2–hM3Dq). (C) Hourly amount of wakefulness (C1), SWS (C2) and REM sleep (C3) following CNO (0.3 mg/kg, N = 6 mice) as compared with control injection. (D1–D3) Percentage of sleep-wake states (±S.E.M.) during the 3 h post-injection period (19:00–22:00), the remainder (9 h) of the dark/active period (22:00–07:00) and the subsequent 12 h light period (07:00–19:00; N = 6 mice). (E1–E3) Number of episodes (±S.E.M.) of wakefulness (W), SWS or REM sleep (RS) in each bout length and (E1’–E3’) time-weighted frequency histograms showing the proportion (±S.E.M.) of W, SWS or RS amounts in each bout length as a percentage of the total amount of W, SWS or RS during the 3 h post-injection period (19:00–22:00; N = 6). (F1–F3) Sleep-wake power spectrum changes over baseline during the 3 h (19:00–22:00) post CNO (0.3 mg/kg, N = 4 mice) injection as compared with control injection; and the quantitative changes (±S.E.M.) in power for the δ (0.4–5 Hz), θ (5–9 Hz), α (9–15 Hz), β (15–30 Hz), low γ (30–60 Hz) and high γ (60–120 Hz) frequency bands (±S.E.M.) following vehicle or CNO (0.3 mg/kg, N = 4 mice) administrations. (C–F) Control injection in Black, CNO injection in red; *p < 0.05, ∗∗p < 0.01, ∗∗∗p < 0.001, two-way ANOVA followed by a post hoc Bonferroni test.

