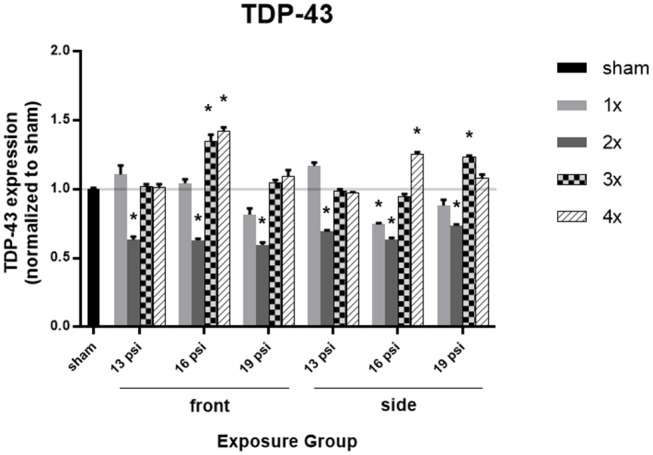
Figure 5.

Quantification of TDP-43 expression measured by Western blot. Results presented as blast intensity for each orientation (front vs. side). Values normalized to sham. Statistical significance compared to sham: *p < 0.05 (Significance values in Supplemental Table 4). Data is expressed as mean ± SEM, normalized to sham. Representative Westerns shown in Supplemental Figure 2.
