
FIGURE 3.
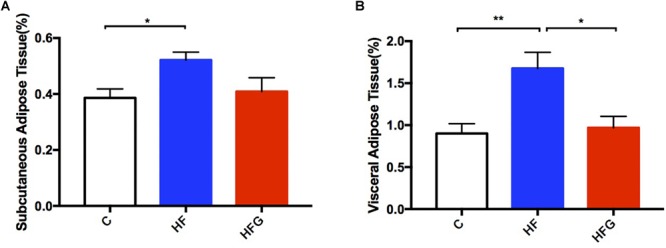
Fat mass of the male offspring at 24 weeks of age. (A) Subcutaneous adipose tissue; and (B) visceral adipose tissue. C, normal control diet; HF, high-fat diet; HFG, high-fat diet with genistein. Data are expressed as means ± S.E.M. (n = 7–8/group). Mean values were significantly different between the groups: ∗p < 0.05, ∗∗p < 0.01.