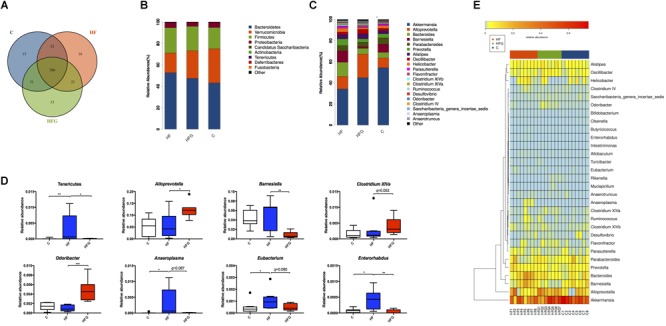
FIGURE 4.

The changes of gut microbiota in adult offspring. (A) Venn diagram of the OUTs; (B) relative abundance of the top ten phyla; (C) relative abundance of the top twenty genera; (D) Significantly different germs at the phylum and genus levels; and (E) Heat map analysis of the different genera among the three group. C, normal control diet; HF, high-fat diet; HFG, high-fat diet with genistein. Data are expressed as means ± S.E.M. (n = 7–8/group). Mean values were significantly different between the groups: ∗q < 0.05, ∗∗q < 0.01.
