
FIGURE 7.
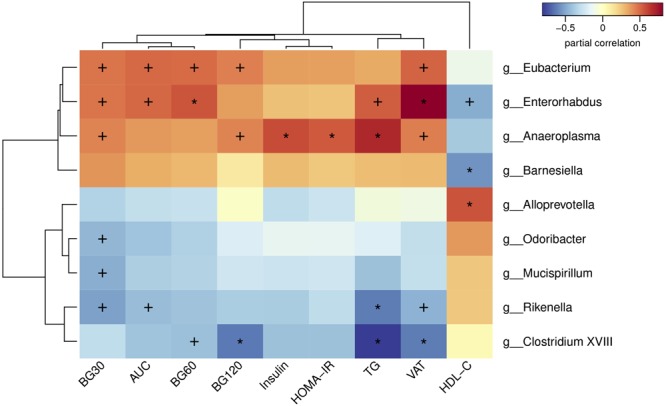
Heatmap of spearman correlation analysis between the altered genera and glucose and lipid metabolic parameters. BG30, blood glucose level at 30 min of OGTT; BG60, blood glucose level at 60 min of OGTT; BG120, blood glucose level at 120 min of OGTT; AUC, area under the curve of OGTT; HOMA-IR, the homeostasis model assessment of insulin resistance; TG, triglyceride; VAT, visceral adipose tissue mass; HDL-C, high-density lipoprotein cholesterol. Values were significantly correlated between the genera and glucose and lipid metabolic parameters: ∗p < 0.05; +p < 0.01.