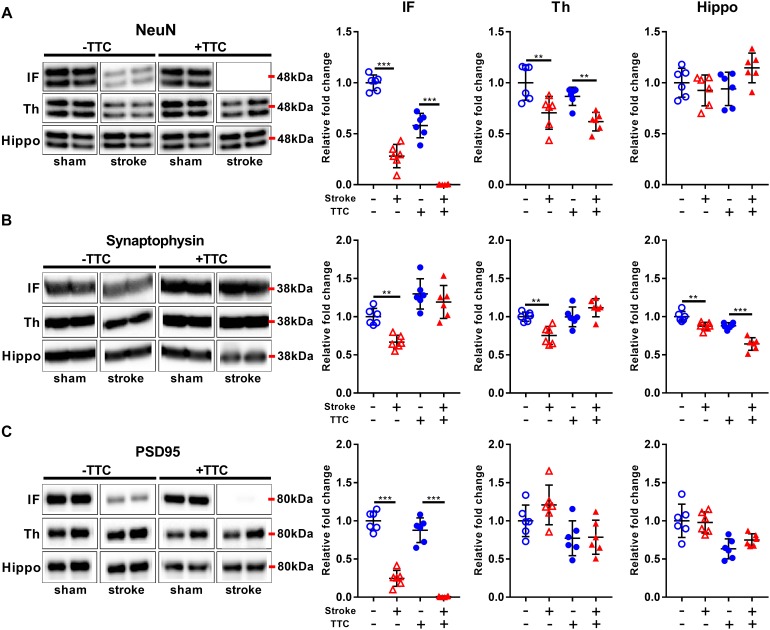
FIGURE 3.
Neuronal markers. Representative western blot and quantification of NeuN (A) Synaptophysin (B), and PSD95 (C) within the infarct (IF), thalamus (Th), and hippocampus (Hippo). Mean ± SEM (two-way ANOVA and Sidak’s multiple comparisons).  TTC– sham;
  TTC– stroke;
  TTC+ sham;
  TTC+ stroke. ∗∗p < 0.01, ∗∗∗p < 0.001.

