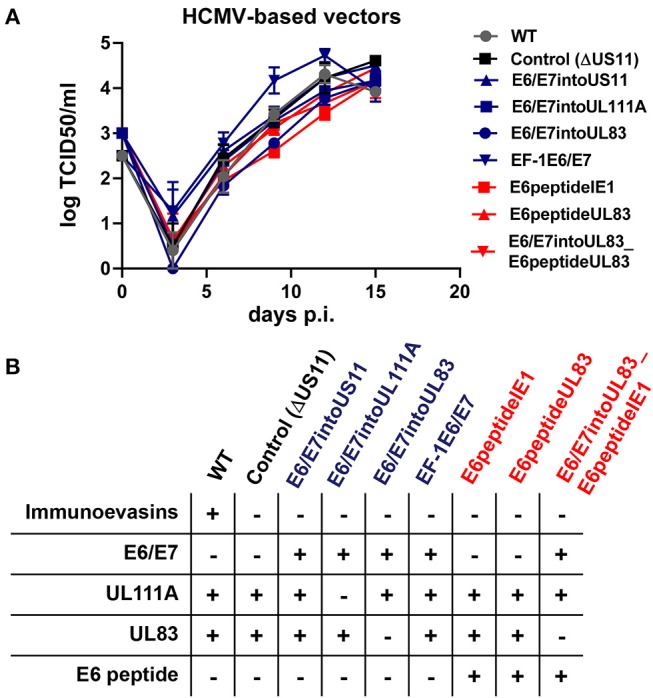
Figure 5.

Features of HCMV-based therapeutic vaccines used in this study. (A) Growth curve kinetics of E6/E7 expressing vaccines (blue) and E6 peptide-expressing vaccines (red). Fi301 cells were infected at MOI of 0.01. Supernatant was collected at different time points after infection and titrated on Fi301 cells to calculate the TCID50. WT TB40/E and RVTB40ΔUS11 served as a control. Results are derived from three experiments; error bars represent the mean ± SEM. (B) Summary of all HCMV-based vectors used in this study.
