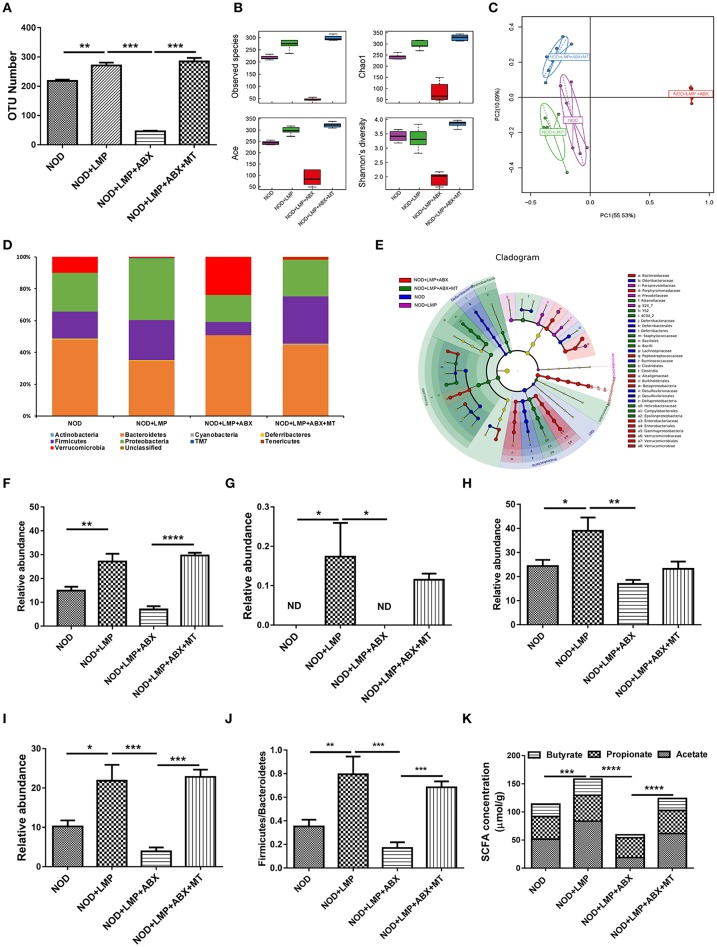
Figure 5.
LMP prevents caecal dysbiosis of microbiota at onset of T1D. (A) The OTU Number among four groups of NOD mice after different treatments. (B) Alpha diversity indices among the four treated groups of NOD mice were displayed using boxplots. (C) Principal Component Analysis (PCA) analysis based on OTU abundance was shown. (D) The taxonomic composition distribution among four groups of phylum-level. (E) Cladograms generated by LEfSe indicate differences in taxa between different groups. (F–J) Relative abundance of Firmicutes (F), TM7 (G), Proteobacteria (H), Clostridia (I), and the ratio of Firmicutes/Bacteroidetes (J) were shown. (K) Acetate, propionate, butyrate in caecal content were analyzed by GC-MS. Bars represent means ± SEM; *p < 0.05; **p < 0.01; ***p < 0.001, and ****p < 0.0001; Each point represents one mice.

