Figure 9.

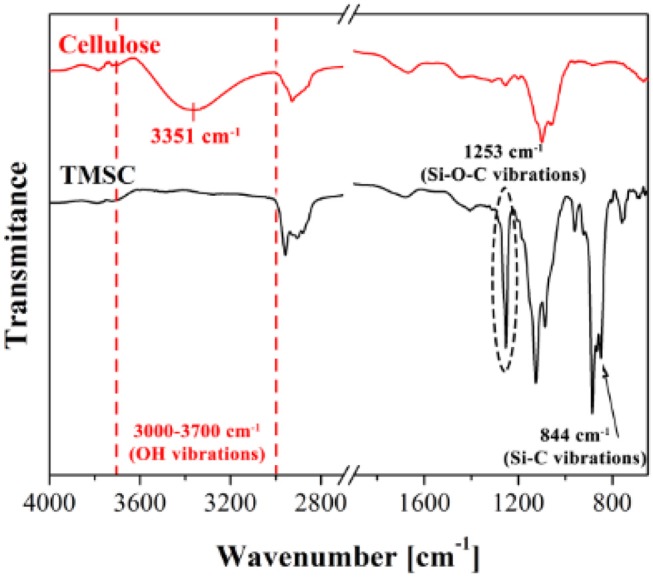
ATR-FTIR spectra of cellulose and TMSC films showing different vibrational bonds. Reproduced with permission from Maver et al. (2015).

ATR-FTIR spectra of cellulose and TMSC films showing different vibrational bonds. Reproduced with permission from Maver et al. (2015).