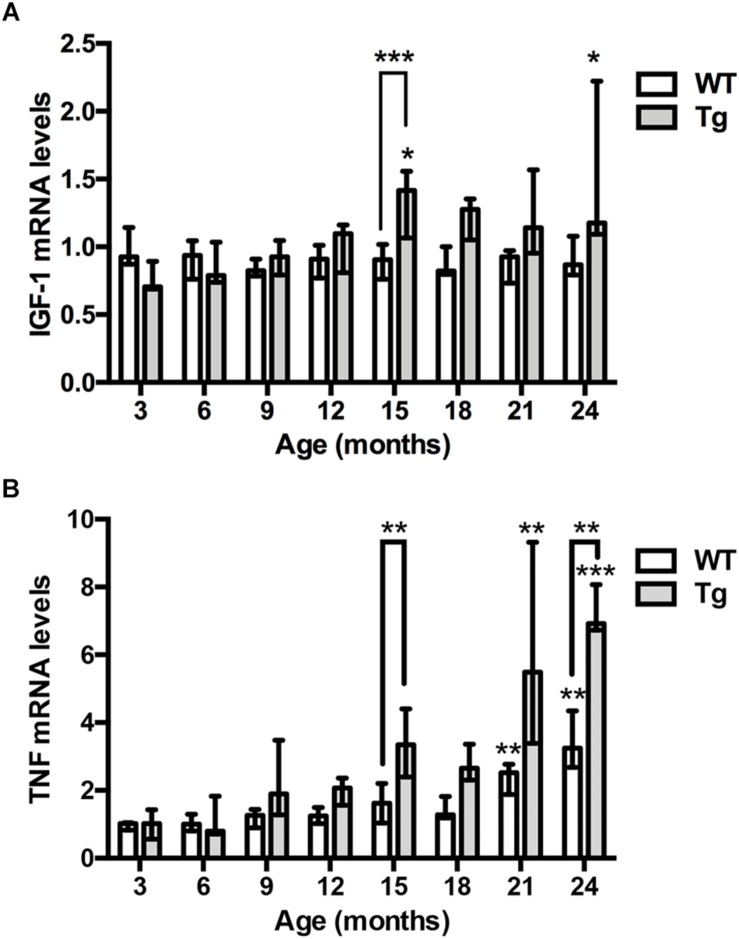
FIGURE 3.
IGF-1 and TNF mRNA levels are elevated in the hippocampus of aging APPswe/PS1ΔE9 Tg mice. (A) Quantitative PCR analysis shows significantly increased hippocampal IGF-1 mRNA levels with age in Tg mice (gray bars), but not WT mice (white bars). Bars represent medians with 25 and 75% quartiles (n = 6–10 per group, except for n = 4 for 18-month-old Tg mice). (B) Quantitative PCR analysis shows significantly increased TNF mRNA levels with age in the hippocampus of both Tg mice (gray bars) and WT mice (white bars). Bars represent medians with 25 and 75% quartiles (n = 6–10 per group). *p < 0.05, ∗∗p < 0.01, ∗∗∗p < 0.001, ∗∗∗p < 0.0001, based on Kruskal–Wallis test followed by Dunn’s multiple comparison test.

