FIGURE 4.
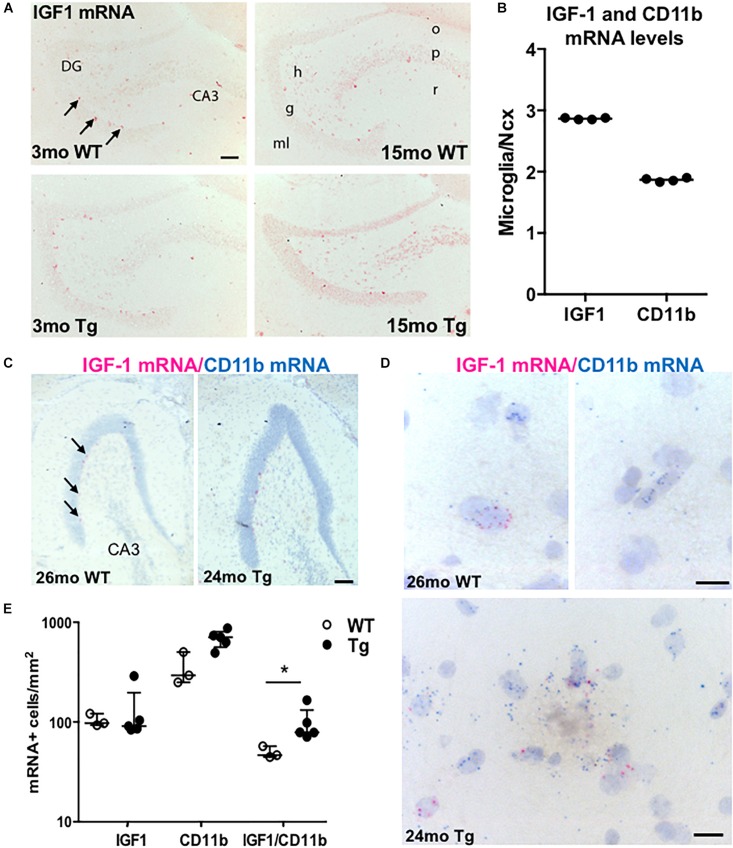
IGF-1 mRNA is expressed in microglia as well as neurons in APPswe/PS1ΔE9 Tg mice. (A) ISH showing IGF-1 mRNA+ cells in the hippocampus of 3- and 15-month-old WT and Tg mice. ISH was performed with AP-conjugated probes. The only clearly visible cells are sgz cells bordering the granular cell layer (arrows) and scattered neurons in the dentate hilus and stratum radiatum of CA3. (B) Scatter-plot showing IGF-1 and CD11b mRNA levels in primary microglia relative to Ncx samples from 3-month-old C57BL/6 mice. Each data point represents one microglial culture from the same experiment. The horizontal bar represents the median. Both genes are more abundantly expressed in primary microglia than in whole Ncx tissue. (C,D) View-RNA double ISH for IGF-1 mRNA (red) and CD11b mRNA (blue) in approx. two-year-old WT and Tg mice. Arrows in (C) point at sgz cells expressing IGF-1 mRNA, as also observed in (A). High magnifications in (D) show single cells expressing IGF-1 mRNA and/or CD11b mRNA in a WT mouse (top panels) and in a Tg mouse (bottom panel). Note the amorphous material in the bottom panel reflecting the presence of an amyloid plaque. (E) Scatter-plot showing the number of IGF-1 mRNA+, CD11b mRNA+, and IGF mRNA-expressing CD11b mRNA+ microglia in WT and Tg mice. Bars represent medians (B,E) with 25 and 75% quartiles (E). CA3, regio inferior hippocampus; DG, dentate gyrus; h, hilus; g, granule cell layer; ml, molecular layer; o, stratum oriens; p, pyramidal cell layer; and r, stratum radiatum. *p < 0.05, Mann–Whitney, unpaired, and two-tailed. Scale bars: 100 μm (A,C), 20 μm (D).

