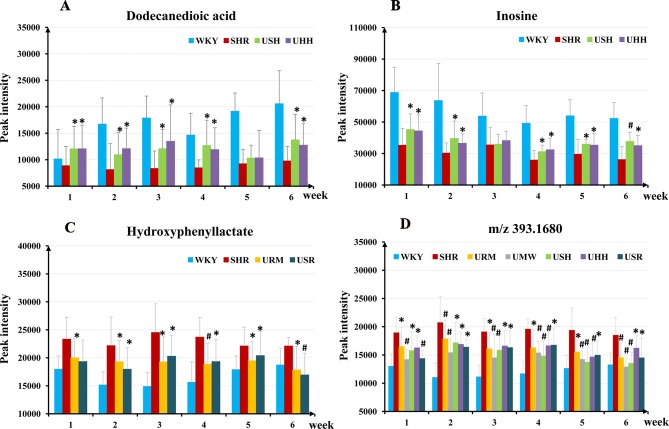
Figure 6.
The relative abundances of the dodecanedioic acid (A), inosine (B), hydroxyphenyllactate (C), and the potential hypertension biomarker (m/z 393.1680) (D) in the WKY group, the SHR group, and the different treatment groups within the 6-week intervention period. *p < 0.05, # p < 0.01 compared to the SHR group.

