Figure 1.
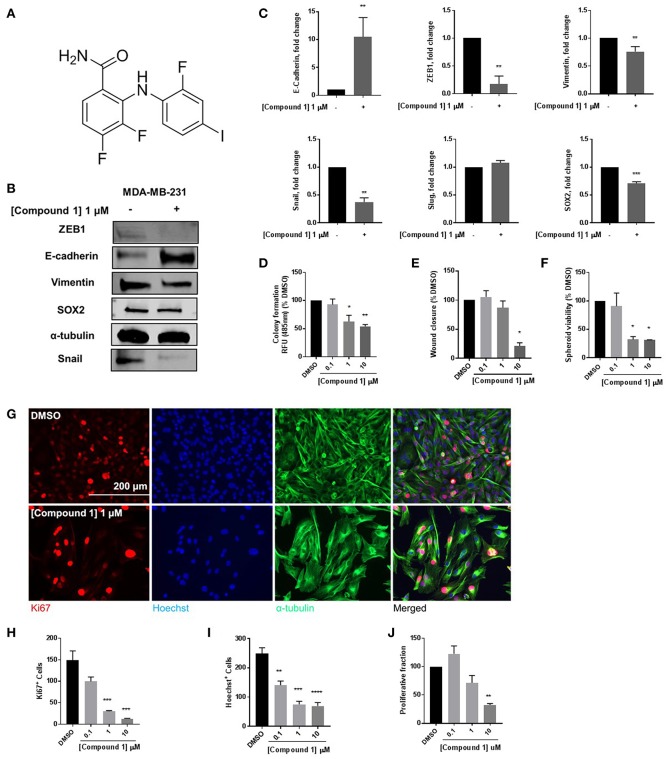
Compound 1 induces MET and decreases colony formation, cell migration, and spheroid formation in MDA-MB-231 cells. (A) Structure of compound 1. (B) Western blot of epithelial marker E-cadherin, mesenchymal markers Vimentin, Snail, and ZEB1, and stemness marker SOX2 in MDA-MB-231 cells. (C) Quantification of protein expression of E-cadherin, ZEB1, vimentin, Snail, Slug, and SOX2. Data represent ± SEM **p < 0.01; ***p < 0.001; vs. DMSO control group determined by two-tailed Student's t-test. (D) Compound 1 inhibited MDA-MB-231 colony formation after 14 days of treatment in a concentration-dependent manner. Data represent ± SEM of experiments run in triplicate, *p < 0.05; **p < 0.01 vs. DMSO control group determined by one-way ANOVA with the Bonferroni post hoc test. (E) Wound closure was measured as a percentage of untreated DMSO control group (missing compound 1 at various conc here). *p < 0.05 vs. DMSO control group determined by one-way ANOVA with the Bonferroni post hoc test (MDA-MB-231 cells). (F) Quantification of the spheroid viability in MDA-MB-231 cells, values indicate ± SEM of three experiments run in triplicate. *p < 0.05 vs. control group determined by one-way ANOVA with the Bonferroni post hoc test in MDA-MB-231 cells. (G) Immunofluorescence staining of Ki67, Hoechst, and α-tubulin in MDA-MB-231 cells treated with DMSO or compound 1 (1 μM), for 72 h, scale bar 200 μm. (H) Ki67+ cells decreased with increasing concentrations of compound 1. (I) Decrease in Hoechst+ cells with increasing concentrations (0.1, 1, 10 μM) of compound 1. (J) The proliferative fraction calculated as the ratio of Ki67+ cells to Hoechst+ cells at increasing concentration. Data represent ± SEM of three different experiments. **p < 0.01; ***p < 0.001 vs. control group determined by one-way ANOVA with the Bonferroni post hoc test.

