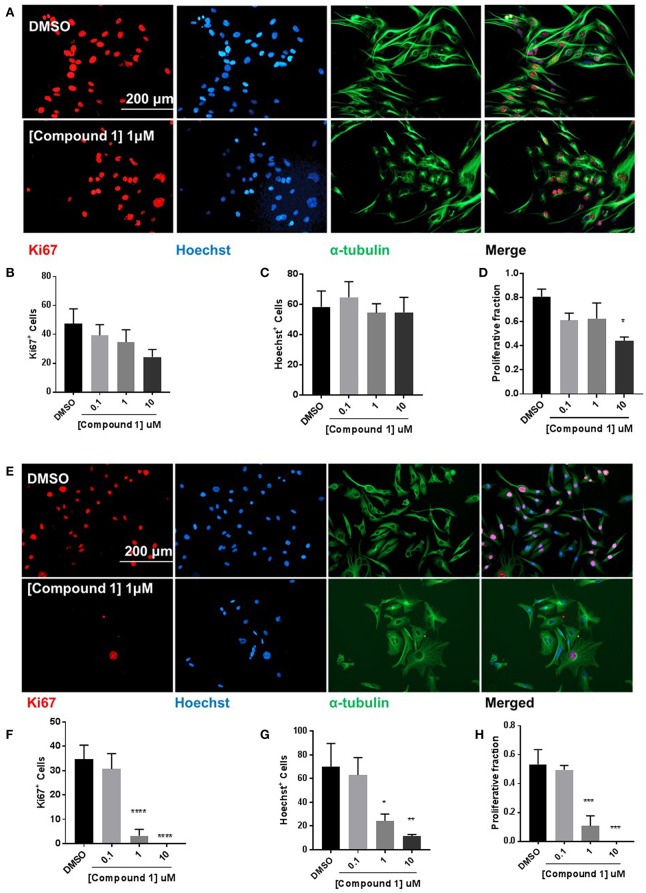
Figure 6.
Compound 1 inhibits cell proliferation in BT-549 and TAMR MCF-7 cells. (A) Immunofluorescence staining of Ki67, Hoechst, and α-tubulin in BT-549 cells treated with DMSO or compound 1 (1 μM), for 72 h, scale bar 200 μm. (B) Ki67+ cells decreased with increasing concentrations (0.1, 1, 10 μM) of compound 1. (C) Decrease in Hoechst+ cells with increasing concentrations (0.1, 1, 10 μM) of compound 1. (D) The proliferative fraction calculated as the ratio of Ki67+ cells to Hoechst+ cells at increasing concentrations (0.1, 1, 10 μM) of compound 1. Data represent ± SEM of three different experiments. *p < 0.05 vs. control group determined by one-way ANOVA with the Bonferroni post hoc test. (E) Immunofluorescence staining of Ki67, Hoechst, and α-tubulin in TAMR MCF-7 cells treated with DMSO or compound 1 (1 μM), for 72 h, scale bar 200 μm. (F) Ki67+ cells decreased with increasing concentrations (0.1, 1, 10 μM) of compound 1. (G) Decrease in Hoechst+ cells with increasing concentrations (0.1, 1, 10 μM) of compound 1. (TAMR MCF-7 cells) (H) The proliferative fraction calculated as the ratio of Ki67+ cells to Hoechst+ cells at increasing concentrations (0.1, 1, 10 μM) of compound 1 (TAMR MCF-7 cells). Data represent ± SEM of three different experiments. *p < 0.05; **p < 0.01; ***p < 0.001; ****p < 0.0001 vs. control group determined by one-way ANOVA with the Bonferroni post hoc test.

