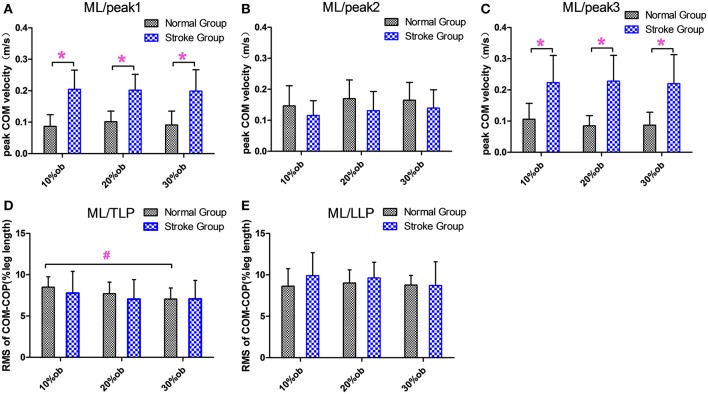
Figure 4.
The balance measurements in the ML direction (Mean and SD). (A) The velocity at the peak 1. (B) The velocity at the peak 2. (C) The velocity at the peak 3. (D) COM-COP distance during TLP. (E) COM-COP distance during LLP. *Reflects the significant difference between groups, #reflects the significant difference between heights. The error bar represents 1 SD.

